RDI - varying Upper and Lower limits
The RDI virtual sensor can calculate a varying upper or lower limit that varies during the season.
The calculation can either...
- A deficit (mm) below the full point
- Relative to the refill point (mm)
- The relative position between refill and full.
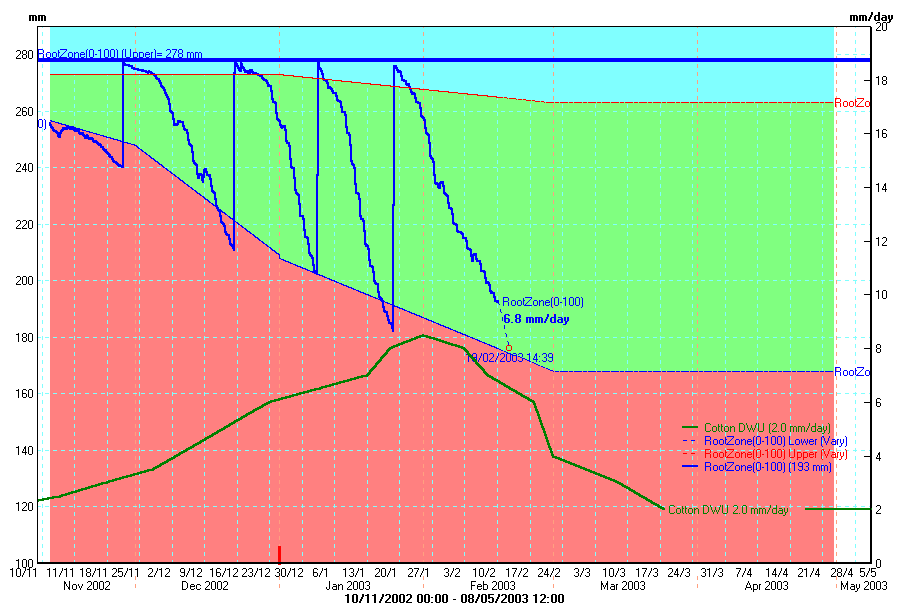
(Soil moisture data courtesy of Goanna Telemetry, Goondiwindi, Australia)
This example is flood-irrigated cotton. The 'refill point', or deficit, needs to vary from about 30mm at the beginning of the season when the plants are young, up to 90mm deficit with mature plants.
The irrigation schedule (prediction) is the date at which the soil moisture will reach the lower limit, 90mm below the full point. The upper limit is set at 10 mm below the full point to avoid water logging, although this is difficult to achieve with flood irrigation.
The daily water use used to predict the next irrigation is the 'historical' daily water use for cotton (also graphed). The data has come from long-term measurements for cotton in this area, and is downloaded from an internet server.
It could have come from a Penman-Monteith type calculation using current weather data.
Below is the file (GENERIC.RDI) used to specify the varying refill and full values...
Date, GrapheHI,  GrapeLo, CottonHi, CottonLo
273,  Relative, Relative,     FULL,     FULL
01 Jul,    0.9,      0.6,       -5,     -10
10 Aug,    0.9,      0.6,       -5,     -10
01 Sep,    1.0,      0.7,       -5,     -10
01 Oct,    0.8,      0.5,       -5,     -10
10 Nov,    0.4,     -0.2,       -5,     -20
01 Dec,    0.2,     -0.2,       -5,     -30
01 Jan,    0.2,     -0.2,       -5,     -70
01 Mar,   0.35,    -0.15,      -15,    -110
01 Apr,    0.3,     -0.1,      -15,    -110
01 May,    0.5,      0.0,      -15,    -110
01 Jun,    0.5,      0.0,      -15,    -110
The file can have a maximum of 10 columns.
The text in the first header line (Date, GrapeHi, etc) indicates the type of crop or soil moisture regime.
The text in the second header line (Relative, Full, etc) signifies whether the values in the columns are...
- Relative between full and refill (0-1).
- Difference from Full (mm).
- Difference from Refill (mm).
Lookup value in a file
Soil tension (measured in kPa) is related to volumetric soil moisture (VSW%) that varies with soil type.
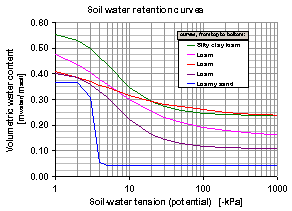
This graph shows typical curves for three different soil types. The data for the curves are below, and can be downloaded in retention.txt.
The relationship is non-linear - the kPa scale is logarithmic. The different curves for different soil type explains why the full point for a clay might be 45%, but a sand could be 15%.
kPa,ClayLoam,Loam,Loam,LoamySand
  1, 55, 48, 40, 37
  2, 52, 44, 38, 37
  3, 50, 40, 35, 30
  4, 46, 38, 33, 5
  7, 39, 33, 27, 4
  8, 38, 33, 25, 4
 40, 26, 22, 13, 4
 60, 25, 21, 13, 4
200, 24, 18, 11, 4
250, 24, 18, 11, 4
The drier the soil (lower VSW%) the higher the tension (kPa). A value of about 6 kPa corresponds to the full point; stress (refill) is at about 60 kPa; and permanent wilting at 200 kPa.
Values of soil moisture measured can be converted to kPa using these curves, and graphed with a lookup calculated sensor.
Use , and create a new sensor.
- Create a new calculate sensor.
- On the formulas tab select LOOKUP.
- Sensor: select the sensor with the soil moisture value (in VSW%).
- Filename:
retention.txt - Known Column: 3 (the values for VSW% in loam are in column 3 in
retention.txt) - Value Column: 1 (the values of kPa are in column 1 in
retention.txt) - Style: Interpolate (interpolate between the values in
retention.txt)