M-Log can graph data from Environment Information Technology data loggers and telemetry systems.
EIT manufacture a range of weather stations, and also supply telemetry systems for the Sentek Enviroscan, Adcon/Agrilink C-Probe, and the EnviroPro soil moisture and salinity system.
Installing M-Log from CD
- Click on
Start - Choose
Run - Enter
D:\MLOG\SETUP.EXE(or useBrowse) - Follow the setup wizard with
Next,Next - If supplied, install M-Log upgrade from disk (
A:\UPGRADE.EXE) - Run M-Log from
Start/Menuor icon.
Then use 'EIT.MDB' to see examples of EIT logger output.

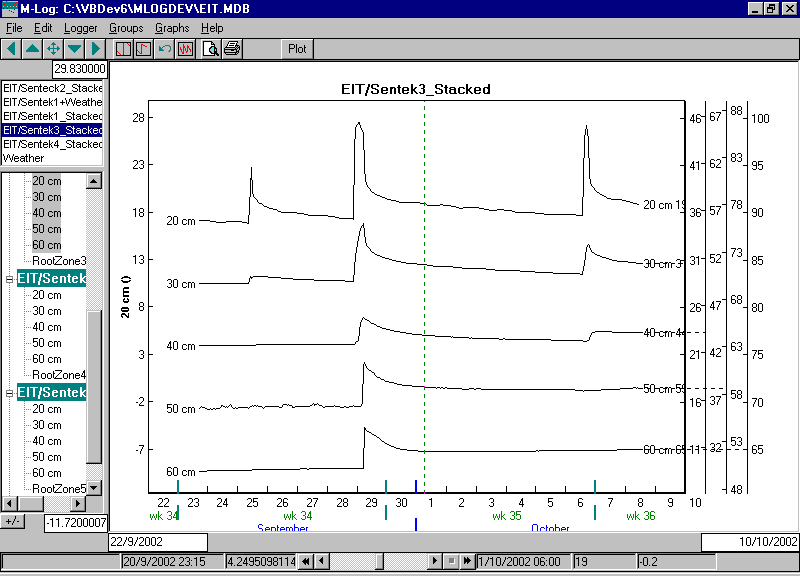
Example of stacked graph of each soil moisture sensor

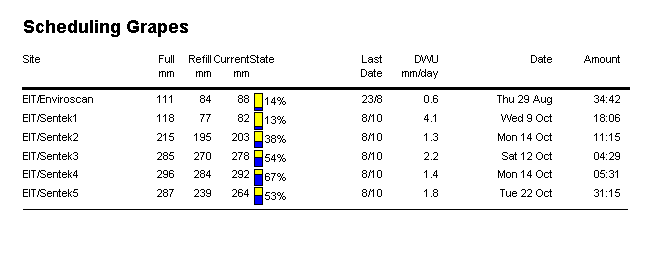
Example of report output summarising the state of all sites

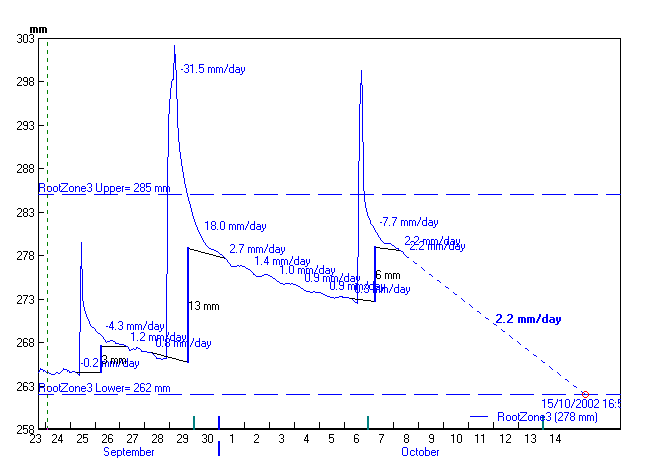
Total water in root zone, with...
- Calculated soil moisture depletion rate
- Irrigation date calculated using this rate
- The effective gain from each irrigation or rainfall.

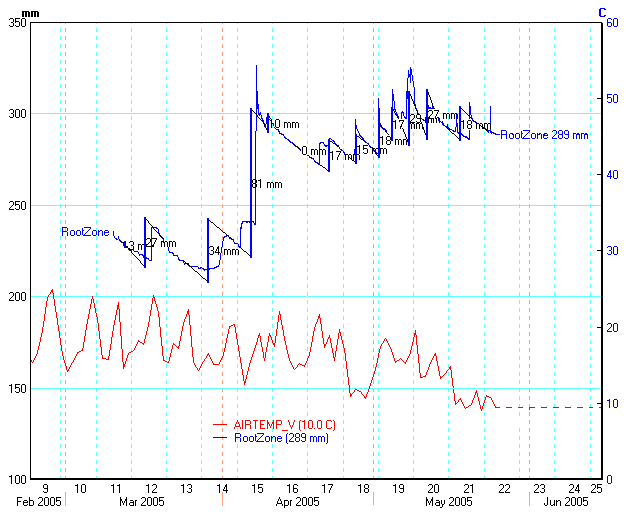
Soil moisture overlaid with temperature from a different logger. The soil moisture data is via EIT web data - the numbers in black are the calculated effective gain of each irrigation.

Example of map output. The base map can be either a map or photograph in BMP, JPG or GIF format; or an ArcInfo GIS/GPS shape file.