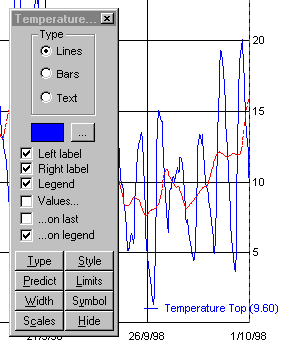

Use to display a floating form to customise the graph.
Each sensor can be plotted using its own colour and line style; a symbol and value at each point; a label at each end of the line; and a legend.
The data can be plotted as a line, or as a bar chart (e.g. rainfalls), or text (comments).
In this example a smoothed data line is also being plotted.