 : information displayed as mouse hovers over point and lines. Points and lines can be dragged - see drag-and-drop.
- : Rate calculations - equal time intervals no longer required. New option to use average from 06:00 - 06:00.
- : ET0 (Penman-Monteith) calculation of ET0 from weather station temperature, RH, Solar radiation and wind speed.
- and : Total Water Content (water balance) calculated from an ET sensor.
- : Total Water Used calculated by accumulating daily water use. Can also be extended to predict water use for entire season.
- : ET using Penman Monteith. requires maximum and minimum air temperatures, RH, solar radiation (MJ).
- : Growing degree days (GDD) - cold shock correction if minimum air temperature below 11 °C GDD reduced by 5.2 °days
- : Sensor Import tab: Scaling as a function of date - e.g. Crop Factor. Scaling factor needs to be in a text file, with format similar to a dwu file.
- : the output of all formulas can also be scaled, as set on .
e.g. ET0 calculated from a weather station could be adjusted by a crop factor that varies with the date.
- : see scheduling
- BugFix: line width change when sysmbols plotted
- BugFix: : bug introduced in v 2.1.036. Logger name added to sensor name.
Calculate ET (Penman-Monteith) from weather station
Evapotranspiration (ET), calculated using the Penman-Monteith (FAO-56) formula, needs hourly weather data (or 15 or 30 minute intervals, but not daily).
The ET is calculated in each interval, and the total mm is summed for each day for graphing, or for use in other formulas.
The calculations are in accordance with FAO Irrigation and Drainage Paper 56 Crop evapotranspiration - Guidelines for computing crop water requirements.
The Penman-Monteith Method HOWELL T.A, EVETT S.R.
 see explanation
Select a weather station logger with daily data, use , and add a new calculated sensor. Select formula: ET0 Daily (FAO 56)

Required inputs...
- Maximum and minimum air temperature in °C eg:
25.1 - Maximum and minimum humidity (RH) in % eg:
49.32 - Solar radiation in watts per sq m (w/m2) eg:
539.30
(Net radiation = (1 - 0.23) * incoming solar radiation) - Wind speed in kph eg:
7.34
Station is optional. It enables minor corrections for station altitude, height, latitude and longitide to be applied
Values need to be entered into a text file - eg: Station: Goanna will get values from file goanna.ini
[General]

Longitude=136

Latitude=-25

Alitude=100

TemperatureUnits=C

RHUnits=%

WSUnits=kph

RadiationUnits=W/m2
Crop factor defaults to a value of 1. The value graphed = ET * CropFactor.
A file can be specified that allows the crop factor to vary with date.
eg: Crop Factor: cotton.fac
0, Factor

1 Aug, 0.30

1 Sep, 0.35

1 Oct, 0.4

1 Nov, 0.5

1 Dec, 1.0

1 Jan, 1.05

1 Feb, 1.0

1 Mar, 1.0

1 Apr, 1.0

1 May, 1.0
Adjust allows ET to be the FAO56 standard for a short crop (Cn=900, Cd=0.34), or a high crop (Cn=1600, Cd=0.38). see here.
Drag and drop
to-be-written
Calculation of Total Water Content from ET
The water balance (or cheque-book) method is to calculate the water left in the soil each day by subtracting the daily value of ET, and adding any irrigations or rainfalls.
M-Log can do the calculattions with either , or as a separate calculated sensor.
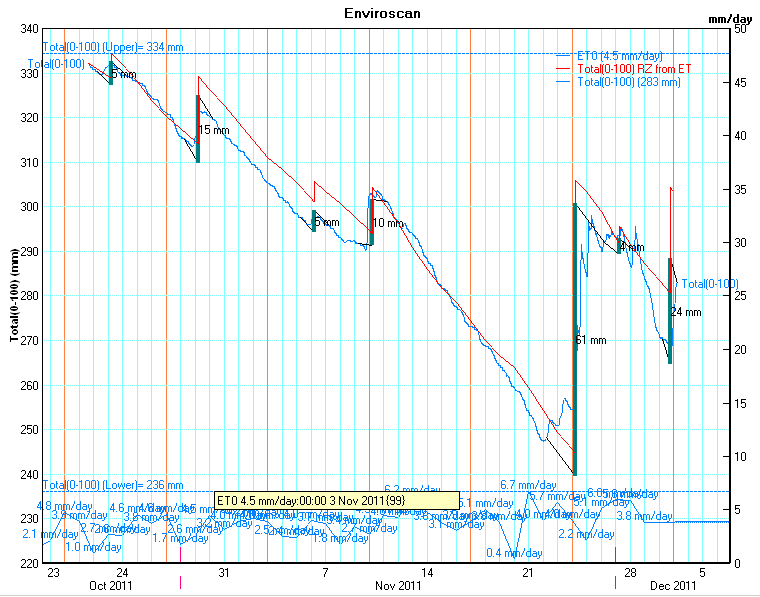
The top blue line is total water content in the profile calculated from soil moisture sensors at different depths.
The vertical bars are probable gains, with the estimated gain amounts (5mm, 15mm, etc) shown as a vertical green bars.
The blue line at the bottom is ET from an NZ scheduling service (???).
The red line is total water content calculated using the ET values.
The starting value is set to be the first measured water content (about 310mm om 24 Oct).
Each day the calculated water content is decreased by the ET value.
After each gain the calculated water content is increased by the estimated gain amount.
If the calculated water content is close to or above the full point, the water content is set equal to the full point.
The ET values could be from a commercial service e.g. iWater, downloaded automatically by M-Log each day, or from a weather station.
As well as allowing colours ,e ct to be set, a calculated sensor also allows the gains to come from a rain sensor, or a sensor recording applied irrigations.
Data courtesy Fruition NZ.
Toal water used by the plant
The total mm through the plant in the season can be calculated by totalling the daily water us. This can be used to estimate of yield, or to calculate yield per Ml. see here.
Extra or calculated ???
Scheduling for whole season
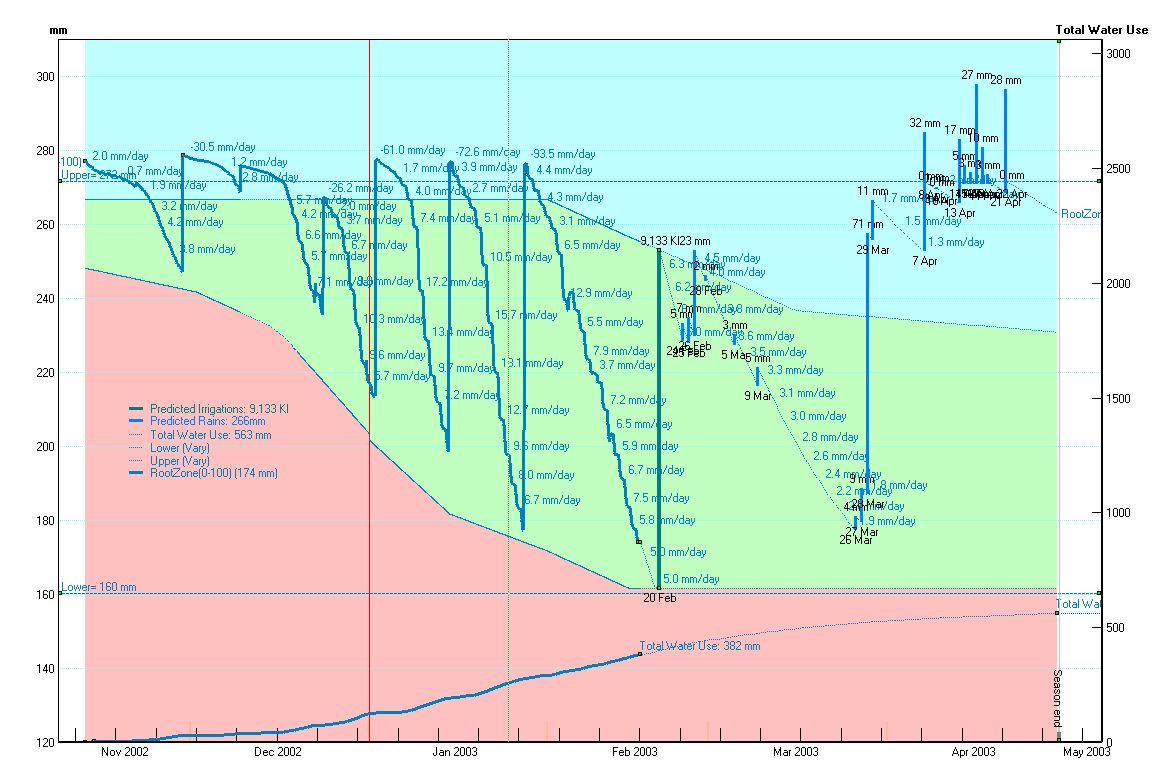
M-Log calculates the next irrigation, and can also calcuate all irrigations required for the rest of the season.

The total water content can be calculated for the whole season.
The last reading was on 20 Feb, and M-Log is then calculating the ideal irrigation schedule for the remainder of the season using ET from a ???
Scheduling can start from last RZ calculated from ETTotal, or a user set RZ1 using drag/drop. Only one prediction line can be plotted at a time: calculated, user or historical. also sets that this et will be used for scheduling Et for remainder od fseason taken from 'historical', of not set from last measured, ig not set from user, if not set = 5 mm/day. the date of next flood irrigation can be 'fixed' drag/drop of user rate for predictions
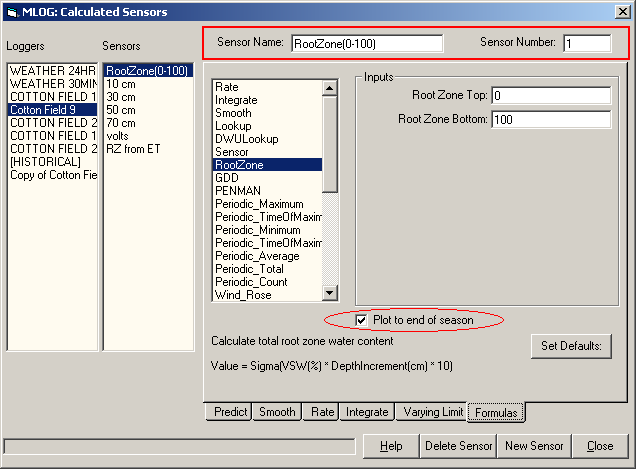
Use , select the calculated RootZone sensor, and on the tab 'Plot to end of season'.
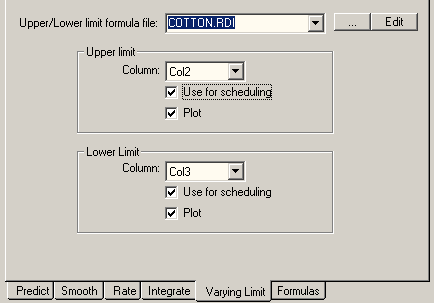
The upper and lower limits are set on the tab. The limits are defined in an RDI file, and can be either...
- mm below FULL
- mm above REFILL
- % between FULL and REFILL
If Use for scheduling is not checked the FULL or REFILL values are used.
The ET used to calculate the schedule is the 'historical' sensor used to calculate the next irrigation selected on the tab. It can be a sensor in a weather station or an ET file. The weather data can be from any year - M-Log will automatically adjust the year.