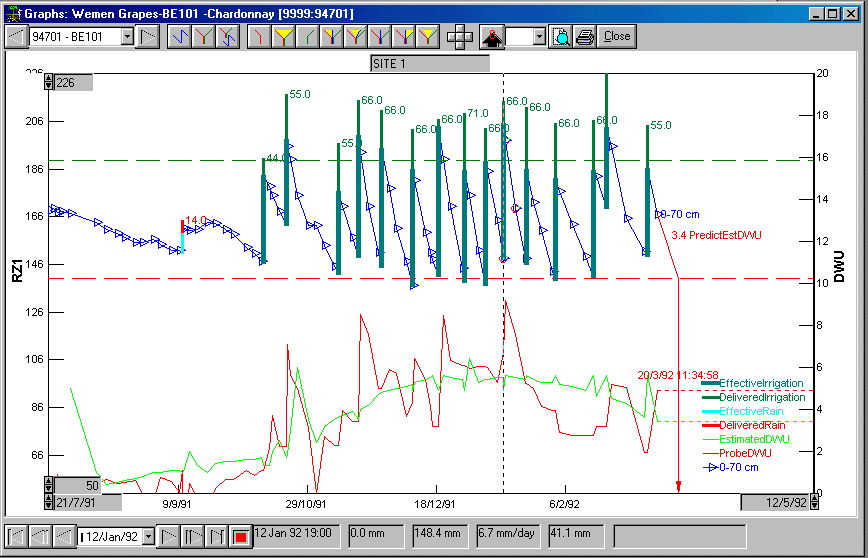
Time Graphs

- Walk through the season with the VCR contols at the bottom
- The current status - date, amount, deficit is shown at the bottom of the screen
- Flash the full, refill, deficit with the command buttons at the top.
- Make a reading the full or refill
point with just a mouse click
- Set the colour of lines with graph styles - change the
‘Effective Irrigation’ style to ‘blue, 2 pts’ and all effective
irrigations will be a thick blue line.
- Rainfalls and irrigations can be plotted either relative to the axis, or on the Root
Zone1 line (as in the example)
- When items have different scales, extra axes on the right side of the graph are
used (DWU scaled 0 - 20 mm/day in the example).
- Lists of data items can be set up for plotting (such as
‘Root Zone1 plus Probe DWU’). Every site can then plot a time graph using the
list.
- As well as directly entering the start and end dates for the graph, you can also enter a
moving window - for example the 60 days up to the current date. As the season
progresses the time graph will ‘move’ through the season.
- The vertical axis can also be set to be a formula (
Full+20 for example) so that the axis is automatically scaled.

