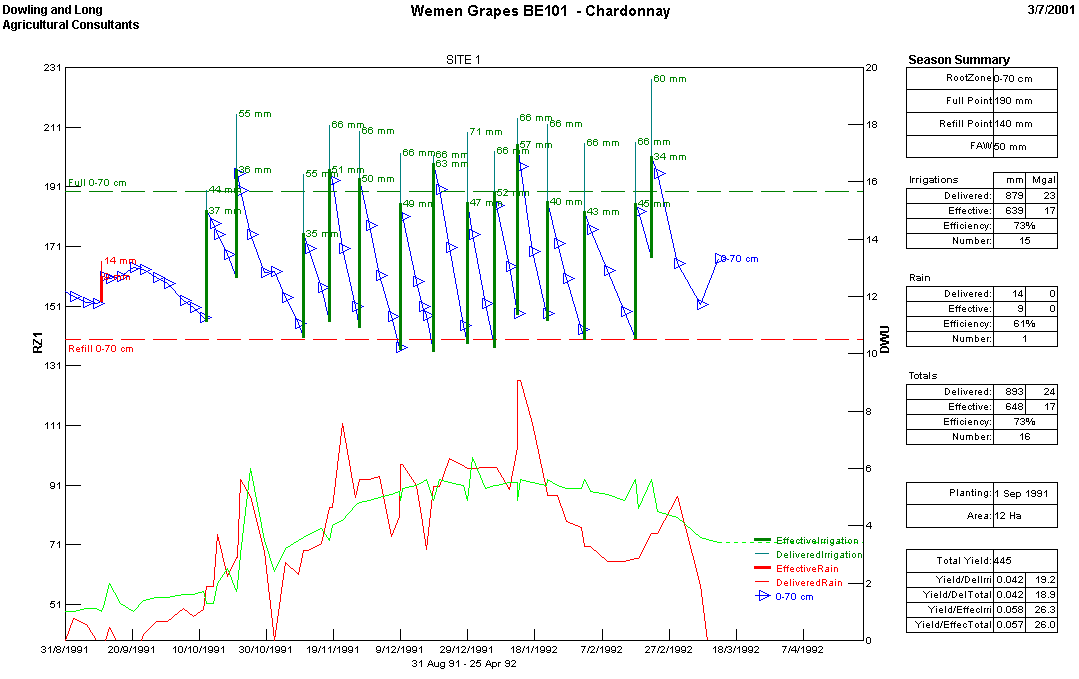

This report is designed to be printed at the end of the season as a summary of the site.
Using this graph could be printed for all sites in 'batch' mode.
The report shows the 0-70 cm root zone water content, the calculated probe dwu and the user entered estimated dwu.
On the right hand side are the total amounts of irrigation and rainfall, delivered and effective, and their efficiencies
Each of the irrigations and rainfalls could also have been plotted on the graph as vertical bars - see the recomendation report
The yield has been entered (bales of cotton in this example), and the report is calculating production efficiency in bales/Ml.