Probe for Windows: Example graph reports
- Highlight the latest reading
- Images and Logos
- Crop target size using straight line
- Crop target size using multiple points
- Fuel gauge, Sentek Gauge, Allocation Bucket, Profile Gauge
- All values available for schedule calculations
- Schedule: Continuous - calculate amount required to reach a target in 7 days
- Schedule: Cyclic - calculate next irrigation when RZ1 reaches STRESS
- Schedule: Cyclic7days - calculate amount required in next 7 days
- Schedule using Agri-tech method
- Critical Dates
- Stress at veraison
- Plot forecast Rain and ET
Highlight the Latest Reading
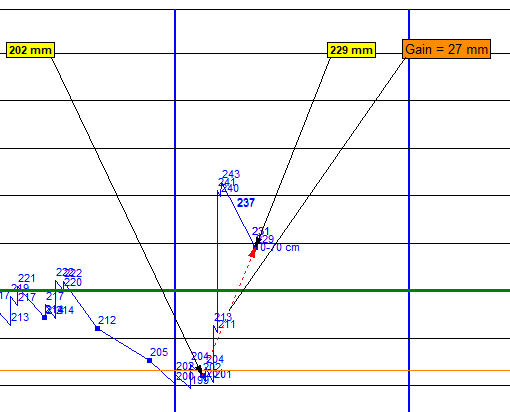
Gain = 27 mm is the gain from the previous week, with the colour depending on gain or loss.
202 mm is last weeks reading, 229 mm is the latest reading, and a red arrow showing net gain
Report: example_highlightlatest . details . top
Images
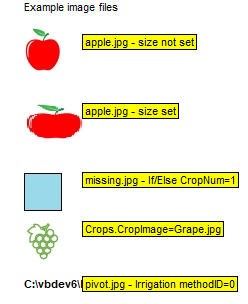
Image files (.jpg or .bmp) for crop type and irrigation method can be output.
The images can be un-distorted, or stretched/shrunk to any size
Report: example_images . details . top
Crop target size using a straight line
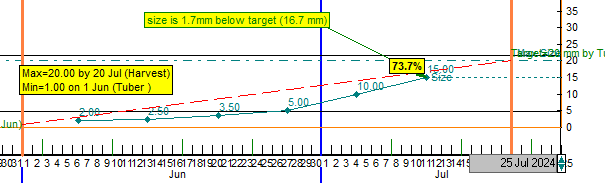
The crop size has been measured each week and entered as keydata items 2.00, 2.50....
This report also plots an ideal crop target size tracking line (red, dash).
The minimum and maximum target size values are entered in the REFILL and FULL columns.
{TODO readings screen dump}
The target maximum value is shown as a horizontal green dash-dot line, from the graph style option
Critical Date 1 is used as the date of minimum size, and Critical Date 6 for the date of maximum size
In the example, the last measured value of 15.00 is 1.7 mm below the target (16.7 mm) - or 73.7% of the target size
These values are calculated in the .gpt file
Report: example_targetsizelinear . details . top
Crop target size with multiple points
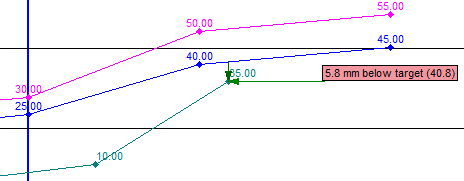
Crop size is being entered as keydata, and this report is also plotting target size tracking lines, with high and low values from a season file (below).
The green 10.00, 85.0 are measured crop size in keydata. {TODO needs legend, RHS axis}
The pink 30.00, 50.00, 55.00 are the high values from column 3 of example.siz file , and the blue 25.00, 40.00, 45.00 are the low values from column 2
In the example, 5.8mm below target (40.8) is a warning that the last measured value (35.00) is 5.8 mm below the calculated minimum target size of 40.8 mm at that date
The line is plotted with PlotExtra(), and values are calculated with function YValueByDate()
Report: example_targetlinesmulti . details . top
File: example.siz...
0,Variety1_Minimum,Variety1_Maximum,Variety2_Minimum,Variety2_Maximum DATE2,2,5 'first sample 1 Jun,10,16 15 Jun,15,22 1 Jul,25,30 10 Jul,40,50 DATE6,45,55 'harvest |
Allocation bucket, Fuel Gauge, Sentek Gauge, Profile changes
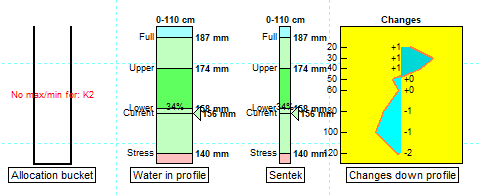
Various Gauges can be included in a report...
The Allocation Bucket is full of water (in blue) at the beginning of the season, and then empties as irrigations are applied and used from the allocation.
The Water In Profile is like a fuel gauge - high after an irrigation or rain, and then reduces as water is used.
The Sentek is similar
The Profile Gauge is a mini-depth graph, but shows mm changes at each depth, and not absolute values.
All Gauges are configured on FileMenu/Export tab: gauges Output to: Graph report
Report: example_gauges> . gpt details . top
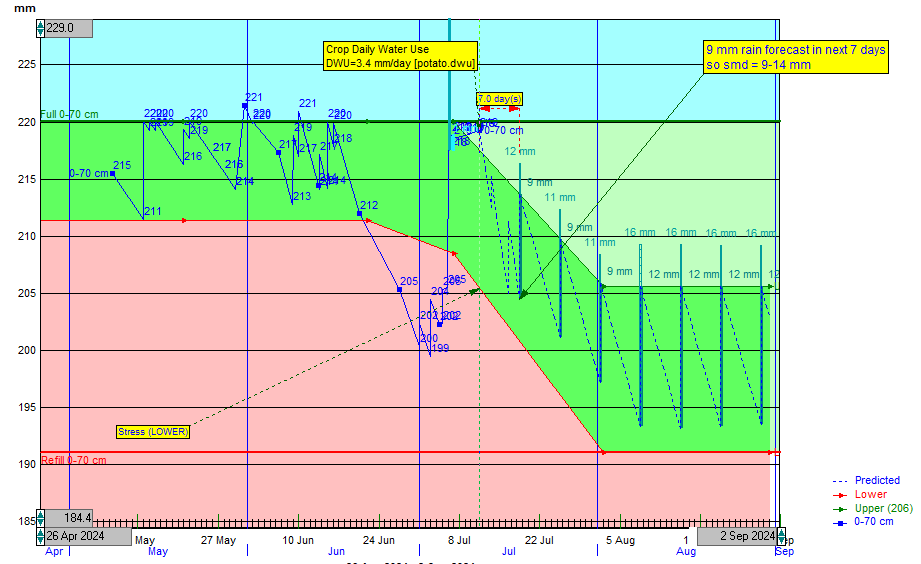
Schedule the next irrigation when RZ1 reaches stress.
ScheduleDate = LatestDate + (RZ1 - STRESS + RAIN) * CropDailyWaterUse
ScheduleAmount = (UPPER - STRESS) * DeliveryFactor
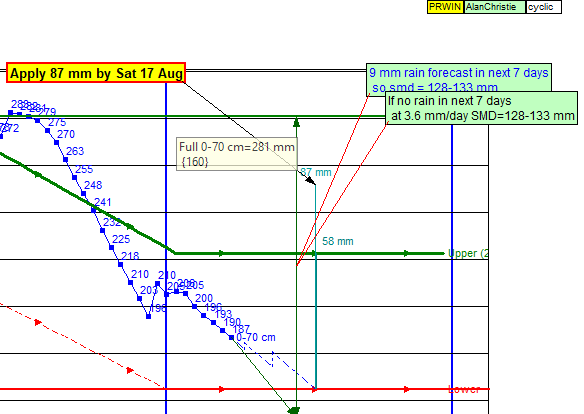
In this example the next irrigation calculation Apply 87 mm by Sat 17 Aug (effective= 58mm delivered= 87 mm) is using 'cyclic' method (irrigate-when-rz1-reaches-stress)
The predicted RZ1 is plotted blue/dash, and includes 9mm forecast rain on day 1 and day 3.
Custom labels with irrigation recommendations can be in various colours and styles.
The report is also calculating using Alan Christie(Agri-tech) - how-much-in-next7days: 9mm rain forecast in next 7 days so smd=128-133mm
Report: example_schedulecyclic . details . top
Schedule: Continous
TargetRZ1In7Days = (UPPER + LOWER) / 2)
AmountRequired = TargetRZ1In7Days - RZ1 + (CropDailyWaterUse * 7) - Rain
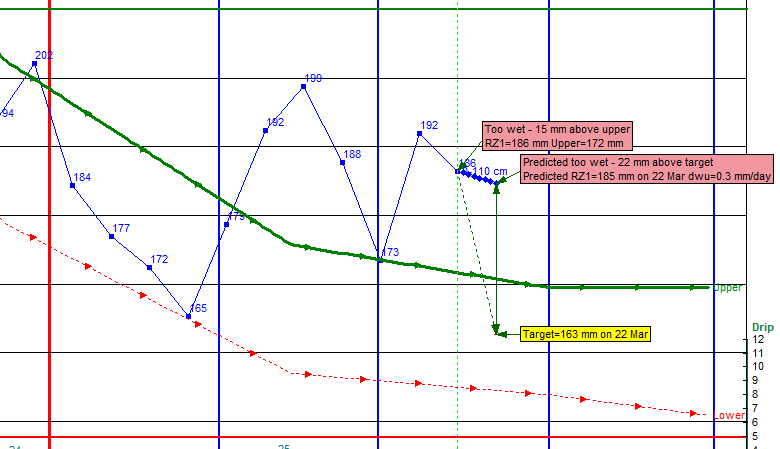
This report displays various messages about the latest reading and the predicted value in 7 days.
Too wet - 15 mm above Upper will only be output if the latest reading (186) is above the Upper value.
Predicted too wet - 22 mm above target will only be output if the predicted value in 7 days (185 mm on 22 Mar) is above the target value (163mm).
Target = 163 mm on 22 Mar will always be output.
Uses functions TargetAMT(), PredictedtAMT()
Report: example_targetrz1 . details . top
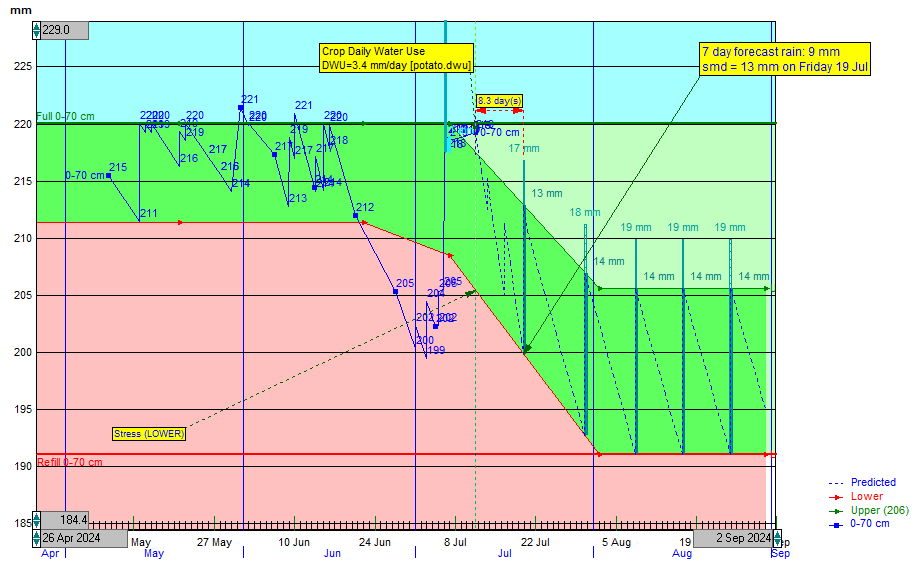
Schedule: Cyclic-next-7days - amount required in next 7 days
DeficitIn7Days = UPPER - (RZ1 - (CropDailyWaterUse * 7) + Rain)
AmountRequired = DeficitIn7Days * DeliveryFactor
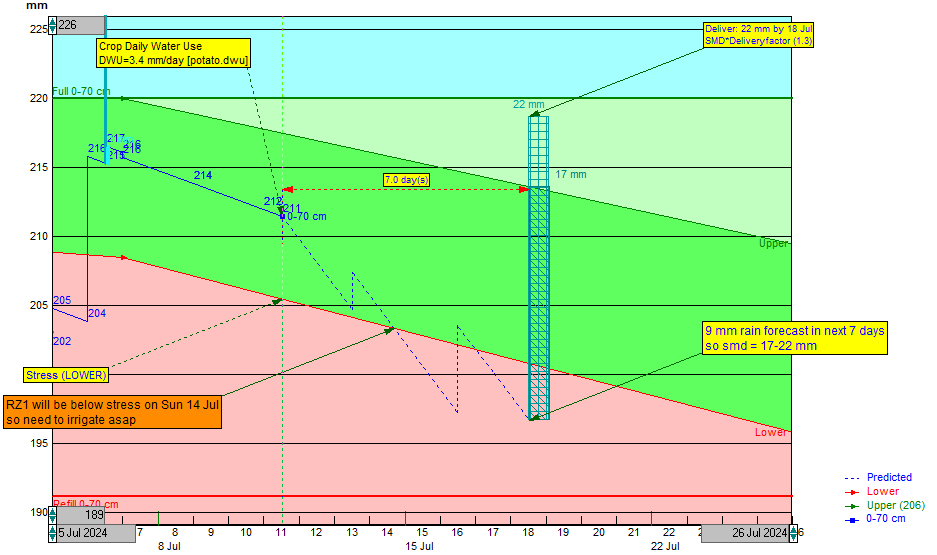
In the graph above, the latest reading was 211mm on 11 July
The predicted crop daily water use = 3.4 mm/day, calculated from potato.dwu.
The crop is annual, so Lower is stress, with the allowed deficit increasing as the roots develop.
The deficit is calculated from UPPER-RZ1, with the upper values reduced later in the season
There is 3 mm of rain forecast on 13 Jul, and 7 mm on 16 July
The deficit on 18 July is 17 mm, but with a delivery factor = 1.2 the amount required = 22 mm.
The warning message is only shown because RZ1 is predicted to go below stress on 14 July.
The values of UPPER and LOWER are specified in pakpot.rdi...
date, Upper, Lower 'headers as a reminder 283,Relative,Relative 'first item must be numeric SeasonStart,1,0.70 pdate,1,0.70 pdate+32,1,0.70 pdate+47,1,0.60 pdate+73,0.5,0.0 SeasonEnd,0.5,0.0 |
The same site, but showing the whole season.
The allowed deficit (lower) is reduced in the early part of the season as roots develop.
There are no forecast rains after the 7-day forecast, but they could have been included by using a previous season weather
Report: example_agritech . details . top
Compare Cyclic and Cyclic-next-7days...
As a comparion, the same site using Method: Cyclic - irrigate when RZ1 reaches stress, and apply enough to get back to upper limit.
All Schedule values

This report shows all variables that are available that can be used to calculate irrigation requirements.
The report can also be used as a check on calculations.
Report: example_schedulevalues . details . top
Critical dates
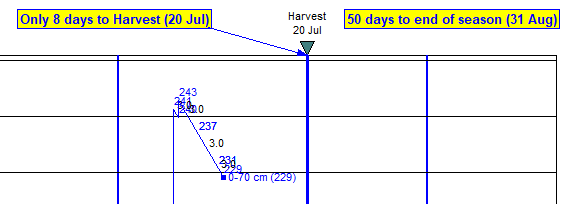
In the example above the grower (potatoes, UK) is being reminded that there is only 8 days to harvest. and that RZ1 is ??mm above target ???
Report: example_critcaldate1 . details . details . top
Stress at Veraison
The irrigation strategy for the crop (grapes, NZ) is to stress the crop by veraison.
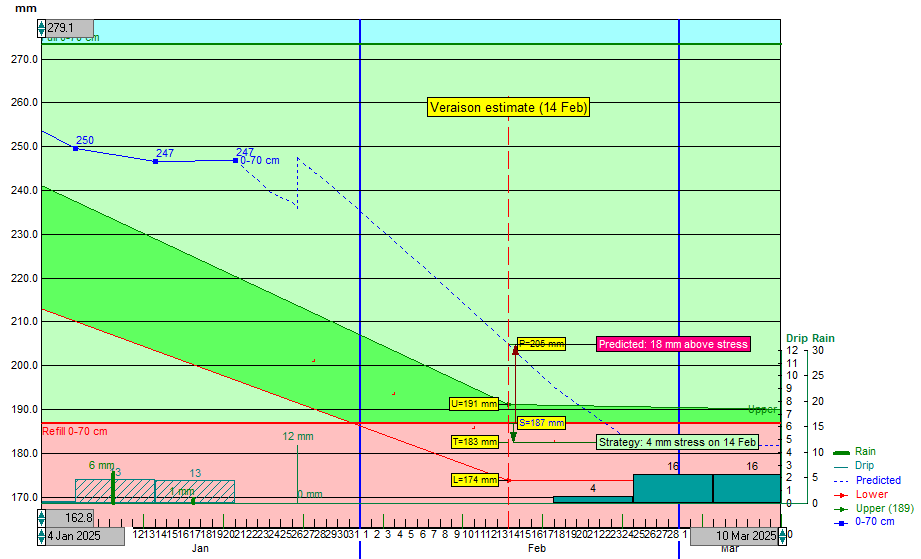
This report shows both the predicted RZ1 and the strategy target RZ1 at verasion,.
The strategy is specified in grapes.rdi (below).
The site is crop type = annual, so stress is constant = REFILL, so S=187mm
The graph is plotting RZ1, Upper, Lower, Refill/Stress (selected on GraphMenu/Styles), Target points, and Predicted RZ1 (set on GraphOptions/Local)
It also shows the predicted values at 14 Feb (veraison)
The last reading was 247 on 20 Jan, with upper, lower, target and predicted values plotted for the rest of the season
At Verasion (14 Feb) the target T=183mm, stress S=187mm , which will be 4 mm of stress,
However, because of 12mm forecast rain on 26 June, the predicted RZ1 is P=205 mm - 18 mm above stress.
These labels will only be shown if the latest reading is before veraison
Report: example_stressatveraison . details . top
Uses functions TargetAMT()
, PredictedAMT()
, StressAMT()
, YDataByValue()
File: grapes.rdi is in season file format...
date, ConservativeHi, ConservativeLo, StandardHi, StandardLo 'column headers as a reminder 283,Relative,Relative,Relative,Relative 'crucial line with numeric as first item SeasonStart, 0.70, 0.20, 0.70, 0.20 'start of season Date1, 0.70, 0.20, 0.70, 0.20 'Bud burst Date1+15, 0.80, 0.20, 0.80, 0.20 '15 days after Bud Burst Date2-10, 0.90, 0.65, 1.00, 0.65 '10 days before Flowering Date2-7, 1.00, 0.68, 1.00, 0.68 '7 days before Flowering Date2, 1.00, 0.68, 1.00, 0.68 'Flowering Date2+7, 0.98, 0.60, 0.98, 0.60 '7 days after Flowering Date2+14, 0.88, 0.50, 0.88, 0.50 '14 days after Flowering Date3, 0.45, 0.15, 0.05, -0.15 'Veraison Date4, 0.35, 0.10, 0.02, -0.15 'Harvest Date4+30, 0.35, 0.05, 0.15, -0.15 '30 days after Harvest SeasonEnd, 0.35, 0.05, 0.15, -0.15 'end of season |
Forecast Rain and ET
Forecast rain and et can be plotted for a site, and also for another location
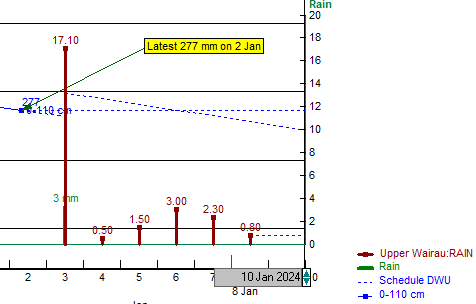
The Rain (3.0 mm) is the forecast for this site.
As a comparison, Upper Wairu:Rain 17.10, 0.50, 1.50.. mm is the forecast rain for another location.
This location could be from a 'live' forecast, or from historical weather data
The Rain is being plotted because GraphMenu/Options/Local Delivered Rainfalls: , using graph style: Rain/Predicted/Actual[S80].
The comparison forecast for Upper Wairu is being plotted from the .gpt file
The graph style (Rain/Predicted/Actual[S80]) was set on ProbeMenu/Forecast tab: Types, but the colour has been set in the .gpt line
Report: example_forecasts . details . top
Calculate where a line (eg RZ1) will cross another line (eg LOWER)
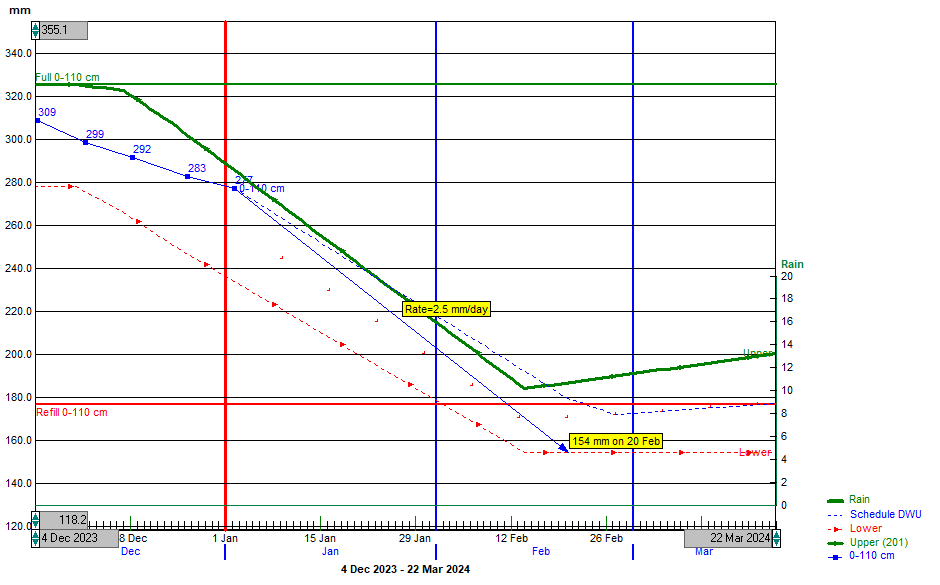
Report: example_intersect
The graph above is showing when RZ1, at dwu=2.5mm/day, will reach LOWER
21,3,INTERSECT,1,RATE,format,align,HGGGGGGGGG,orientation,size,BLACK,CRNTDATE,CRNTAMT,3.15, 'line1: 1 point plus rate(dwu)=3.15 mm/day = SITEGDWU
21,4,INTERSECT,2,LOWER,format,align,HGGGGGGGGG,orientation,size,BLACK,TXMIN,REFILL,TXMAX,REFILL 'line2: LOWER varying
21,5,ARROW,source,arrow from LatestReading to intersect,format,align,HGGGGGGGGG,orientation,1,RED,CRNTDATE,CRNTAMT,INTERSECTX,INTERSECTY
Examples.gpt file
Group,Order,Type,Source,Alias,format,Align,Options,Orientation,Size,Colour,Left,Top,Width,Height

'time graph scales
'TXMIN= left date axis
'TXMAX= right date axis
'TYMIN= LHS axis bottom
'TYMAX= LHS axis top

'depth graph scales
'DXMIN= VSW axis left (minimum)
'DXMAX= VSW axis righ (maximum)
'DYMIN= depth axis bottom
'DYMAX= depth axis top

'TYRelative(), TXRelative()

'named colours: RED,GREEN, etc see https://www.rsne.com.au/prwin3/repdefs.htm#colourcodes
'other colour examples
'coral = #ff7f50 orange=#ff8c00 deep pink #ff1493 green #008000 dark green #006400 dark red #8B0000 see: https://www.w3schools.com/cssref/css_colors.php

'graph styles used in these examples for scaling to RHS axis
'hard-coded styles - ie StyleID is hardcoded
'StyleID=45 Key1  (crop size saved in K1)
'StyleID=49 Key1  (crop size saved in K1) - AgriTech swapped
'StyleID=79 = EffectiveRainPredict
'StyleID=80 = DeliveredRainPredict
'StyleID=83 = Drip/Predicted/Effective - reserved, not used
'StyleID=84 = Drip/Predicted/Actual - reserved
'StyleID=11 = Rain/Actual - reserved
'StyleID=4 = EstimatedDWU - reserved

'User styles
'StyleID=89='TargetSize' scale for 'size'

'StyleID scaling must use either numeric (%SCREEN), or a formula that returns main LHS axis (mm)

'gpt line options: GGGGGGGGGG  [1]=border H=ON, [2]=bold H=ON, [3]=units H=ON, [4]=negative-in-red  [5]=FillStyle (G=none, H=solid, I=diagonal, J=???TODO), [6]=LineStyle (G=solid, H=dash, I=dot etc), [7]=spare
'[n] is a character options string:  HGGGGGHGGGG option  see: https://www.rsne.com.au/prwin/repdefs.htm#optioncodes

'Note: Option(n) is a site-specific user choice, although some can be site-specific (local) or apply to all sites (global)
'eg Option(4) = Plot Delivered Rain  see https://www.rsne.com.au/prwin/repdefs.htm#graphoption

'BeginIf/ElseIf/Else/EndIf   Select/Case,Else,EndSelect

'===========================
'output all examples
1,1,ReportTitle,example_all
1,2,INCLUDE,example_highlightlatest       'Highlight Latest
1,3,INCLUDE,example_images                'Images
1,4,INCLUDE,example_targetsizelinear       'Target Line Linear
1,5,INCLUDE,example_targetlinesmulti       'Target Line Multiple Points
1,6,INCLUDE,example_gauges                 'Gauges
1,7,INCLUDE,example_schedulevalues         'Schedule Values
1,8,INCLUDE,example_schedulecyclic          'Schedule Cyclic
1,9,INCLUDE,example_scheduleAgritech       'Schedule Agritech
1,10,INCLUDE,example_criticaldates          'Critical Dates
1,11,INCLUDE,example_stressatverasion  'Stress at Veraison'
1,12,INCLUDE,example_forecasts             'Plot Forecasts

'======================================
2,1,REPORTTITLE,example_highlightlatest '

'labels and arrows pointing at last 2 readings

'latest reading, formatted in mm, [1] border, [2]=bold, [3]=units,[5]=fill. positioned 10 days after CRNTDATE and 5 mm higher
2,2,FORMULA,CRNTAMT,latest RZ1,AMT,align,HHHGHGGGGGGGG,ABOVERIGHT,100,BLACK,CRNTDATE+10,CRNTAMT+5,,

'arrow pointing from label to latest reading, 1pt, dark green
2,3,ARROW,source,1 pt black arrow pointing to latest reading,format,align,GGGGGGGGGG,orientation,1.5,DARKGREEN,CRNTDATE+10,CRNTAMT+5,CRNTDATE,CRNTAMT

'only output if previous reading RZ1 is on the graph
2,5,BEGINIF,PREVDATE>TXMIN

	'previous RZ1 is past left axis, on the graph area

	'output previous RZ1, formatted mm|ins, [1] border, [2] bold, [3] units, [5] filled, positioned 10 days before previous reading,
	2,6,FORMULA,PREVAMT,Last weeks RZ1,AMT,Left,HHHGHGGGGGGGGGGGGG,ABOVELEFT,100,BLACK,PREVDATE-10,PREVAMT+5,,

	'1pt black arrow pointing from 2,5 FORMULA to the previous reading
	2,6,ARROW,source,1pt black arrow pointing to previous reading,format,align,GGGGGGGGGGGGG,orientation,1.5,DARKGREEN,PREVDATE-10,PREVAMT+5,PREVDATE,PREVAMT

	'show change in RZ1 half-way between Previous and Latest, and a line showing the change
	'too cluttered  !
	'2,7,FORMULA,(CRNTAMT-PREVAMT),GAIN,AMT,1,HHHHGGGGGGGGGGGG,Centre,,BLACK,(CRNTDATE+PREVDATE)/2,+10+(CRNTAMT+PREVAMT)/2,,
	'2,7,Arrow,source,Black 2pt arrow showing gain from last week,format,align,GGGGGGGGGGGG,orientation,2,BLACK,PREVDATE-20,PREVAMT+10,CRNTDATE+10,CRNTAMT+10

	'show change in RZ1 in last week
	'Gain' or 'Loss' saved in variable 'gain_text'
	'NOTE: use type=TEXT to save a text variable
	2,9,BEGINIF,CRNTAMT>PREVAMT

		'RZ1 is higher than previous RZ1
		2,10,text,gain_text=Gain
		2,10,FILLCOLOUR,source,alias,format,align,GGGGGGGGGGGGGGG,orientation,size,ORANGE

	2,11,ELSE

		2,12,text,gain_text=Loss
		2,12,FILLCOLOUR,source,alias,format,align,GGGGGGGGGGGGGGG,orientation,size,PALEBLUE

	2,13,ENDIF

	'label with [1] border,[2] not bold,[5] FillStyle=H=solid  20 days after RZ1. 10% below top of timegraph
	2,15,LABEL,%gain_text% = %ABS(CRNTAMT-PREVAMT):AMT:1%,There has been a gain this week,format,align,HGGGHGGGGGGGGG,ABOVERIGHT,120,BLACK,CRNTDATE+20,TYRELATIVE(10),,

	'arrow pointing from previousRZ1 to currentRZ1 [6]=linestyle = I = dot, 1pt, RED
	2,16,ARROW,source,1pt black arrow pointing from previous to current,format,align,GGGGGIGGGGGGGG,orientation,1,RED,PREVDATE,PREVAMT,CRNTDATE,RZ1

	'1pt solid line from 2,15 label to middle of arrow
	2,17,LINE,source,1pt black line pointing to middle of arrow,format,align,GGGGGGGGGGGGG,0,1,BLACK,CRNTDATE+20,TYRELATIVE(10),(CRNTDATE+PREVDATE)/2,(RZ1+PREVAMT)/2

2,18,ENDIF 'PrevDate past left axis

'==========================
3,1,REPORTTITLE,example_images '
'image files must be .jpg or .bmp, and in folder: PRWIN\reports\

'heading above all images
3,2,LABEL,Example image files,alias,format,align,GGGGGGGGGG,ABOVERIGHT,100,BLACK,80,2

'if only X1,Y1 is specified (top,left), and X2,Y2 blank, the image is *not* distorted
3,3,PICTURE,apple.jpg,This site is growing apples,format,align,HGGGGGGGGG,orientation,size,colour,80,4
3,4,LABEL,apple.jpg - size not set,alias,format,align,HGGGGGGGGGG,BELOWRIGHT,80,BLACK,85,5

'if x2,y2 are also specified the image will be squeezed/stretched into the rectangle
3,5,PICTURE,apple.jpg,alias,format,align,GGGGGGGGGG,orientation,size,colour,80,15,85,20
3,6,LABEL,apple.jpg - size set,alias,format,align,HGGGGGGGGGG,BELOWRIGHT,size,BLACK,85,15

'Method(1) get the name of the image file depending on CropNum and hold in 'pic_crop'
'NOTE: must use type=TEXT for text assignment
3,7,LABEL,{CropNum=%CropNum%},alias,format,align,GGGGGGGGGGG,ABOVERIGHT,size,RED,85,25 'jusr for checking

'use Select/Case because can handle multiple values
3,8,SELECT,CropNum

3,9,CASE,33

	'Crops.ID = 33 = Potato
	3,10,TEXT,pic_crop=potato.jpg

3~11~CASE~18,9,10  '~ delimiter because using ',' in CASE list

	'Crops.ID = 8,9,10 are all Hops
	3,12,TEXT,pic_crop=hop.jpg

3,13,ELSE

	'all other crops are grapes
	3,14,TEXT,pic_crop=grape.jpg

3,15,ENDSELECT

'output the selected image, no distortion
3,20,PICTURE,%pic_crop%,Image from Crop,format,align,GGGGGGGGGGG,orientation,size,colour,80,25,,
3,21,LABEL,%pic_crop% [CropNum=%CropNum%],Image name from If/Else/EndIf,format,align,HGGGGGGGGGG,BELOWRIGHT,size,Black,85,25

'Method(2) get the name of the file entered on ProbeMenu/Crops  CROPS.CROPIMAGE
3,22,PICTURE,%CROPIMAGE%,Image from CROPS.CROPIMAGE,format,align,GGGGGGGGGGG,orientation,size,colour,80,32
3,23,LABEL,Crops.CropImage=%CropImage%,Image from CropImage,format,align,HGGGGGGGGGG,BELOWRIGHT,size,BLACK,85,32

'Irrigation Method - hold image in variable 'pic_method'
3,24,BEGINIF,MethodID=2

	'continuous (drip)
	3,25,TEXT,pic_method=dripper.jpg

3,26,ELSE

	'cyclic
	3,27,TEXT,pic_method=pivot.jpg

	'show a micro-jet instead !
	3,27,TEXT,pic_method=sprinkler.jpg

3,28,ENDIF

'output image. only X1,Y1 so no distortion
3,29,PICTURE,%pic_method%,alias,format,align,HGGGGGGGGGG,orientation,size,colour,80,40
3,30,LABEL,%pic_method% {MethodID=%MethodID%},alias,format,align,HGGGGGGGGGG,BELOWRIGHT,size,BLACK,85,40

'=============================
4,1,ReportTitle,example_targetsizelinear '
'crop size has been entered in K1, and are being plotted  'Agritech 2024 site BONES3 site=2302
'maximum and minimum size have been entered in K1_FULL and K1_REFILL
'NOTE:all K1's will need changing if size is entered in another keydata row
'CriticalDate1 used as start of straight line
'CriticalDate6 used as end of straight line eg 'Harvest'

'put GraphStyleID=89 in variable -  used for axis scale (see top)
4,24,TEXT,target_graphstyle=49
'4,24,TEXT,target_graphstyle=129 'added by user for plotting 'size'

'4,2,BEGINIF,K1_FULL 'do method(1) if a maximum value has been entered

'Method[1] - straight line using K1_FULL and K1_REFILLl
'plot straight line showing target during the season, width=1pt, colour=#008000, [6]=LineStyle = I = dot
'GraphStyleID=49 is the style used to plot 'size' in K1, and is required for axis scale
4,3,LINE,source,Ideal tracking line for crop size,format,align,GGGGGIGGGGGGGGGGGG,orientation,1,LIGHTGREEN,DATE1,K1_REFILL,DATE6,K1_FULL,%target_graphstyle%
4,3,LEGEND,Size target,alias,format,align,GGGGGIGGGGGGGGGGGG,orientation,1,LIGHTGREEN,,,,,%target_graphstyle%

'label at start of target line (left of start) #008000 = light green X=DATE1, Y=K1_REFILL
4,4,LABEL,Target=%K1_REFILL:0:0% mm by %DATE1:d mmm:0% (%Date1Text%),alias,format,align,HGGGGGGGGGGGGG,LEFTPLUS,size,LIGHTGREEN,DATE1,K1_REFILL,,,%target_graphstyle%

'label at end of target line X = DATE6  Y = K1_FULL
4,5,LABEL,Target=%K1_FULL:0:0% mm by %DATE6:d mmm:0% (%Date6Text%),alias,format,align,HGGGGGGGGGGGGG,ABOVERIGHT,size,LIGHTGREEN,DATE6,K1_FULL,,,%target_graphstyle%

'calculate value of target at CRNTDATE using equation of straight line
4,6,formula,TARGET_SIZE=K1_REFILL + (CRNTDATE-DATE1) * ((K1_FULL-K1_REFILL)/(DATE6-DATE1))

'calculate proportion between maximum and minimum
4,6,formula,TARGET_PROPORTION=(K1-K1_REFILL)/(K1_FULL-K1_REFILL)

'calculate difference between K1 (measured) and Target.  ABS() makes the value positive
4,10,formula,TARGET_DIFFERENCE=ABS(K1-TARGET_SIZE)

4,7,BEGINIF,K1 < TARGET_SIZE

	'size is below target, so text='below'
	8,6,TEXT,TARGET_DIFFERENCETEXT=below

4,8,ELSE

	'size is above target, so text='above'
	4,8,TEXT,TARGET_DIFFERENCETEXT=above

4,9,ENDIF

'output label with 'difference' formatted to 1 decimal place, border, left and above latest size, StyleID=49 for axis scale
4,11,LABEL,size is %TARGET_DIFFERENCE:0.0:0%mm %TARGET_DIFFERENCETEXT% target (%TARGET_SIZE:0.0:0% mm),alias,format,align,HGGGGGGGGG,ABOVELEFT,100,#008000,CRNTDATE-10,K1+15,,,%target_graphstyle%

'arrow from 4,10 label pointing to latest size (K1), I=dash
4,12,ARROW,source,arrow pointing to latest size,format,align,GGGGGHGGGGG,orientation,1,#008000,CRNTDATE-10,K1+15,CRNTDATE,K1,49

'show %  size / size range
'4,13,Formula,TARGET_PROPORTION,RED,0%,Left,HHHHGGGGGGGGGG,Centre,,BLACK,70,80 'CRNTDATE,K11,,,%target_graphstyle% 'current value as % scale using style=49

'current value as % scale using style=49
4,14,Formula,TARGET_SIZE,RED,0.0%,Left,HHHHGGGGGGGGGG,AboveLeftPlus,,BLACK,LPRBDATE,K1,,,%target_graphstyle%

'maximum and minimum values on 2 lines
4,16,Label,Maximum=%K1_FULL% by %DATE6:d mmm% (%Date6Text%)|Minimum=%K1_REFILL% on %DATE1:d mmm% (%Date1Text%),RED,0.0%,align,HGGGGGGGGGGG,ABOVERIGHT,size,BLACK,DATE1,K1-5,,,%target_graphstyle%

'4,17,ELSE

4,1,ReportTitle,example_targetlinesmulti '

'Method(2) - tracking values from file: example.siz
'plot maximum values from example.siz, values in column 1. [6]LineStyle=H=dash, 1pt, DARKBLUE, axis scale from GraphStyleID=89
4,20,PLOTEXTRA,example.siz,Minimum tracking size for crop,0.0,align,GGGGGHGGGGGGGGGGGG,orientation,1,DARKBLUE,,,,,%target_graphstyle%
'variable EXTRA = index of last PLOTEXTRA

'get minimum at CRNTDATE
'YValueByDate(Date,EXTRA) returns the Y value of an 'extra' line at 'date'
'NB use ~ delimiter because ',' used in function
4~21~formula~TARGET_MINIMUM = YValueByDate(CRNTDATE, Extra)

'also plot maximum from example.siz, column 2
4,22,PLOTEXTRA,example.siz:2,Maximum tracking line for crop,0.0,align,GGGGGIGGGGGGGGGGG,orientation,1,LIGHTBLUE,,,,,%target_graphstyle%
'get maximum value at CRNTDATE
4~23~formula~TARGET_MAXIMUM = YValueByDate(CRNTDATE, Extra)

4,25,BEGINIF,K1 > TARGET_MAXIMUM

		'above maximum target
		4,26,FILLCOLOUR,source,alias,format,align,HGGGHGGGGGG,orientation,size,WARNING
		4,26,LABEL,%K1-TARGET_MAXIMUM:0.0:0% mm above target (%TARGET_MAXIMUM:0.0:0%),alias,format,align,HGGGHGGGGG,ABOVERIGHT,100,BLACK,CRNTDATE+5,K1,,,%target_graphstyle%

		'vertical arrow from K1 to target maximum, StyleID=49 for axis scale
		4,26,ARROW,source,arrow pointing max to min,format,align,GGGGGGGGGG,orientation,1,DARKGREEN,CRNTDATE,TARGET_MAXIMUM,CRNTDATE,K1,%target_graphstyle%

4,27,BEGINELSEIF,K1 < TARGET_MINIMUM

	'below minimum target
	4,28,FILLCOLOUR,source,alias,format,align,HGGGHGGGGGG,orientation,size,WARNING
	4,28,LABEL,%TARGET_MINIMUM-K1:0.0:0% mm below target (%TARGET_MINIMUM:0.0:0%),alias,format,align,HGGGHGGGGG,ABOVERIGHT,100,BLACK,CRNTDATE+5,K1,,,%target_graphstyle%

	'vertical arrow from target pointing to K1, StyleID=49 for axis scale
	4,28,ARROW,source,arrow pointing K1 to target,format,align,GGGGGGGGGG,orientation,1,DARKGREEN,CRNTDATE,TARGET_MINIMUM,CRNTDATE,K1,%target_graphstyle%

4,29,ELSE

	'between max/min
	4,30,LABEL,%K1:0.0:0%mm inside target range (%TARGET_MINIMUM:0.0:0%-%TARGET_MAXIMUM:0.0:0%mm),alias,format,align,HGGGHGGGGGG,ABOVERIGHT,100,BLACK,CRNTDATE+5,K1,,,%target_graphstyle%
	'vertical arrow showing max/min range, K1, StyleID=49 for axis scale
	4,30,DOUBLEARROW,source,arrow pointing max to min,format,align,GGGGGGGGGG,orientation,1,DARKGREEN,CRNTDATE,TARGET_MINIMUM,CRNTDATE,TARGET_MAXIMUM,%target_graphstyle%

4,31,ENDIF

'arrow from label pointing to latest size, StyleID=49 for axis scale
4,32,ARROW,source,arrow pointing to latest value,format,align,GGGGGGGGGG,orientation,1,DARKGREEN,CRNTDATE+5,K1,CRNTDATE,K1,%target_graphstyle%

'4,33,ENDIF

'======================================================================
5,1,ReportTitle,example_gauges '

'gauges configured on FileMenu/Export tab: Gauges, OutputTo=GraphReport

'Profile Gauge showing changes, both VSW and mm, at different depths
5,2,PROFILEGAUGE,K5,Changes,VSW,0,GHHGGGJJHGGGHGGG,0,80,Black,85,20,95,40
5,3,LABEL,Changes down profile,alias,format,align,HGGGGGGGGGG,BELOWPLUS,size,BLACK,90,40

'Sentek gauge is a diagram with arrow pointing to current state
'vertical scale from full=100% to refill=0%. right scale mm, text size = 80%
'alias=caption above
5,7,GAUGE,RZ1,RZTEXT1,format,align,GGGGGGGGGGGG,orientation,80,colour,80,20,81,40
5,8,Label,Sentek,alias,format,align,HGGGGGGGGGG,BELOWPLUS,size,BLACK,80.5,40

'PRWIN fuel gauge shows how much water that is available to the plant remains in the profile
'left scale from full (100%) to empty (0%) right scale in  mm
'source = RZ1,FULL,REFILL  alias=caption above, 80%
5,4,GAUGE,RZ1,RZTEXT1,format,align,GGGGGGGGGGG,orientate,80,colour,70,20,73,40
5,5,Label,Water in profile,alias,format,align,HGGGGGGGGGG,BELOWPLUS,size,BLACK,71,40

'blue arrow pointing from the fuel gauge to the last RZ1 reading on the time graph
'5,6,ARROW,RZ1,Arrow pointing to last RZ1,format,align,GGGGGGGGGGGGG,orientate,1,BLUE,51.5,41,DATE_LASTP,RZ1

'Allocation - bucket of water that is full at the start of the season, and empties during the season
'assume K2 has value = @DIFF(meter), alias = caption
5,9,BUCKET,K2,Allocation (Kl/Ha),VOL,0,GGGGGGGGGGGGG,1,80,BLACK,60,20,63,40
5,10,Label,Allocation bucket,alias,format,align,HGGGGGGGGGG,BELOWPLUS,size,BLACK,61.5,40

'TODO check for Alex Virgo
'blue arrow, dash, from bottom of bucket to last point of K2 plot on time graph
'GraphStyle.ID = 49 for RHS scale
'5,11,ARROW,source,Arrow pointing to last value,0,0,GGGGGHGGGGGGGHGGGG,0,0.5,BLUE,61.5,40,DATE_LASTP,K2,49

'5,12,LINE,K15,AllocationTrack,VOL,0,GHGGKKKGGGGG,0,1,RED,DATE_FIRSTP,K15_FIRSTP,SEASONEND,K15_FULL
'5,13,LINE,K10,AllocationTrack,VOL,0,GGGGGGGGKKKGGG,0,1,RED,DATE_FIRSTP,@GSY(54, K10_FULL),SEASONEND,@GSY(54, K10_REFILL)
'TEMPO 5,14,LINE,K5,VirgoAllocationTrack,Alias,0,GGGGGGGGGGGGGG,0,1,54,DATE_C3,K5_C3,SEASONEND,K5_FULL,54

'plot keydata row 11
'5,15,PlotRow,K1,Size,0,Left,GGGGGGGGGG,orientation,size,BLACK,X1,Y1,X2,Y2
'5,16,Label,Size: %K11% - %K11_FULL:0.0:0%,alias,format,Left,GGGGGGGGGG,orientation,110,RED,82,5,90,10
'5,17,FORMULA,(K1-K1_REFILL)/(K1_FULL-K1_REFILL),alias,0%,LEFT,GGGGGGGGGG,orientation,110,RED,90,5,98,10

'==========================================
7,1,ReportTitle,example_schedulevalues '
7,2,INCLUDE,example_check '

'output all schedule values
'MethodID=0 = cyclic - colour - dark red #8B0000
'MethodID=1 = amount-in-7-days - colour - dark red #8B0000
'MethodID=2 = continous - colour = dark green: #006400

'labels at top
7,3,LABEL,All schedule values,alias,format,CENTRE,GGGGGGGGGGG,orientation,size,BLACK,88,4,99,7
7,4,LABEL,Variable,Name of variable,format,RIGHT,GGGGGGGGGGG,orientation,size,BLACK,78,7,88,10
7,5,LABEL,Numeric,numeric value 2 decimal places,0.00,RIGHT,GGGGGGGGGG,orientation,size,BLACK,88,7,93,10 'H=border
7,6,LABEL,Text,text version or formatted,format,RIGHT,GGGGGGGGGG,orientation,size,Black,93,7,99,10

'Forecast values. Might might not be used in the prediction calculations
6,7,LABEL,ForecastRain,alias,format,RIGHT,GGGGGGGGGGG,orientation,size,BLACK,78,10,88,13
6,8,FORMULA,ForecastRain,the total amount has come from a 7 day forecast in mm/ins,0.00,RIGHT,HGGGGGGGGG,orientation,size,BLACK,88,10,93,13,91 'H=border 91=Information TEMPO
6,9,TEXT,ForecastRain_T,the total amount has come from a 7 day forecast already formatted,format,RIGHT,HGGGGGGGGG,,,BLACK,93,10,99,13

'arrow pointing to forecast rain
6,7,BEGINIF,(ForecastRain>0) AND Option(2) 'Option(2) = plot-delivered-rain. see https://www.rsne.com.au/prwin/repdefs.htm#optioncodes  (4=Plot-delivered-Irrigation)

	'delivered rain is being plotted
	'rain(s) will be somewhere in drip period, StyleID=80 for axis scale
	6,8,ARROW,source,point to forecast rain,format,align,GGGGGIGGGGG,orientation,1,#006400,88,11.5,CRNTDATE+dripdays/2,ForecastRain,80

6,10,ENDIF 'ForecastRain > 0

'forecast ET
6,11,LABEL,ForecastET,alias,format,RIGHT,GGGGGGGGGGG,orientation,size,BLACK,78,13,88,16
6,12,FORMULA,ForecastET,numeric with format=dwu,0.00,RIGHT,HGGGGGGGGG,orientation,size,BLACK,88,13,93,16,90 'Style=90=Warning
6,13,TEXT,ForecastET_T,ForecastET_T,format,RIGHT,HGGGGGGGGG,orientation,size,BLACK,93,13,99,16

'blue line to separate values actually used to calculate predicted schedule
6,14,LINE,source,Values used to calculate predicted schedule,format,align,GGGGGGGGGGG,orientation,1,blue,84,16.5,99,16.5

'Rain used in schedule calculation - where is this used ???
6,15,LABEL,PredictedRain,,,RIGHT,GGGGGGGGGGG,,,BLACK,78,17,88,20
6,16,FORMULA,PredictedRain,,0.00,RIGHT,HGGGGGGGGG,,,BLACK,88,17,93,20
6,17,TEXT,PredictedRain_T,,,RIGHT,HGGGGGGGGG,,,BLACK,93,17,99,20

'ET used ???
6,18,LABEL,PredictedET,,,RIGHT,GGGGGGGGGGG,,,BLACK,78,20,88,23

6,99,BEGINIF,PredictedET<0.5

	6,16,TEXT,predicted_colour=warning

6,99,ELSE

	6,16,TEXT,predicted_colour=PaleGreen

6,99,ENDIF  'PredictedET>0.5

6,19,FORMULA,PredictedET,,0.00,RIGHT,HGGGGGGGG,,,BLACK,88,20,93,23
6,20,TEXT,PredictedET_T,,,RIGHT,HGGGGGGGGG,,,BLACK,93,20,99,23

'average Kcrop used in schedule calculation.  Enabled on ReadingsMenu/Scheduling tab: ???
6,21,LABEL,PredictedKc,,,RIGHT,GGGGGGGGGGG,,,BLACK,78,23,88,26
6,22,FORMULA,PredictedKC,alias,0.00,RIGHT,HGGGGGGGGGG,orientation,size,BLACK,88,23,93,26
6,23,TEXT,PredictedKC_T,alias,format,RIGHT,HGGGGGGGGGG,orientation,size,BLACK,93,23,99,26

'average Ksoil used in schedule calculation.  Enabled on ReadingsMenu/Scheduling tab: ???
6,24,LABEL,PredictedKs,alias,format,RIGHT,GGGGGGGGGGG,orientation,size,BLACK,78,26,88,29
6,25,FORMULA,PredictedKs,alias,0.00,RIGHT,HGGGGGGGGGG,orientation,size,BLACK,88,26,93,29
6,26,TEXT,PredictedKs_T,alias,format,RIGHT,HGGGGGGGGGG,orientation,size,BLACK,93,26,99,29

'ET used in schedule calculation.  Selected on ReadingsMenu/Scheduling
6,27,LABEL,ScheduleDWU,alias,format,RIGHT,GGGGGGGGGGG,orientation,size,BLACK,78,29,88,32
6,28,FORMULA,ScheduleDWU,alias,0.00,RIGHT,HGGGGGGGGGG,orientation,size,BLACK,88,29,93,32
6,29,FORMULA,ScheduleDWU,alias,DWU,RIGHT,HGHGGGGGGGG,orientation,size,BLACK,93,29,99,32

'arrow pointing to middle of predicted RZ line
'too confusing
6,30,BEGINIF,Option(11) '(11) = 'Plot Schedule' on GraphMenu/Options/Local tab: time graph

	6,31,BEGINIF,MethodID=2

		'continuous - point to middle of predicted RZ1 line
		'6,32,ARROW,source,Continuous: This is SCHEDULEDATE,format,align,GGGGGIGGGGG,,1,#006400,88,30.5,(CRNTDATE+SCHEDULEDATE)/2,(SUPPERAMT+SLOWERAMT)/2

	6,33,ELSE

		'cyclic
		'6,34,ARROW,source,Cyclic this is SCHEDULEDATE,format,align,GGGGGIGGGGG,orientation,1,#8B0000,88,30.5,SCHEDULEDATE,SUPPERAMT

	6,35,ENDIF

6,36,ENDIF 'plot schedule

'delivery factor Deliver = Effective * Factor  Set on ReadingsMenu/Schedule tab: Deliver
6,37,LABEL,Factor2,alias,format,RIGHT,GGGGGGGGGGG,orientation,size,BLACK,78,32,88,35
6,38,FORMULA,FACTOR2,alias,0.00,RIGHT,HGGGGGGGGGG,orientation,size,BLACK,88,32,93,35
6,39,LABEL,del=effective*factor2,alias,format,RIGHT,GGGGGGGGGGG,BELOWRIGHT,size,BLACK,93,32,,

'see https:///rsne.com.au/prwin/formulas.htm#stressamt
6,40,LABEL,StressAMT(CrntDate),alias,format,RIGHT,GGGGGGGGGGG,orientation,size,BLACK,78,35,88,38
'output calculated stress amount, and hold value in 'stress_rz1'
6,41,FORMULA,stress_rz1=StressAMT(CRNTDATE),alias,0.00,RIGHT,HGHGGGGGGGG,orientation,size,BLACK,88,35,93,38
6,42,LABEL,annual|permanent,alias,format,RIGHT,GGHGGGGGGGG,BELOWRIGHT,size,BLACK,93,35,, 'reminder

'arrow point to ???
6,43,ARROW,source,alias,format,align,GGGGGIGGGGG,orientation,1,#8B0000,88,36.5,CRNTDATE,STRESS_RZ1

'ScheduleAMT = EfectiveAmount * FACTOR2
'show how FACTOR2 is used

'calculate 'extra' due to FACTOR2
'6,7,FORMULA,extra=(SUPPERAMT - SLOWERAMT) * (FACTOR2 - 1)
6,44,FORMULA,extra=SCHEDULEAMT - (SCHEDULEAMT/FACTOR2)

'calculate mid point between SUPPERAMT and top of irrigation (SLOWERAMT+SHEDULEAMT) for cyclic
6,45,FORMULA,midpoint=SUPPERAMT+extra/2

'6,46,LABEL,Predictions plotted [%Option(11)%],alias,format,align,GGGGGGGGGGG,BELOWRIGHT,size,BLUE,3,3

5,7,BEGINIF,Option(11) '11='plot predictions' GraphMenu/Options/Local tab: Time Graph  see https:www.rsne.com.au/prwin3/repdefs.htm#optioncodes

	5,7,LABEL,Predictions plotted [%Option(11)%],alias,format,align,GGGGGGGGGGG,BELOWRIGHT,size,BLUE,0,0

	5,7,BEGINIF,MethodID=2

		'continous StyleID=84 (DripPredict)
		'5,7,ARROW,source,Extra amount from FACTOR2,format,align,GGGGGIGGGGG,orientation,size,#006400,SCHEDULEDATE,SUPPERAMT,SCHEDULEDATE,SUPPERAMT+extra,84

		'arrow pointing to drip block
		'5,7,ARROW,source,Continuous:Point to ScheduleAMT at ScheduleDate,format,align,GGGGGIGGGGG,orientation,size,#006400,88,39.5,SCHEDULEDATE,SCHEDULEAMT,84

	5,7,ELSE
		'cyclic - vertical line showing predicted gain
		5,7,ARROW,source,Extra amount from FACTOR2,format,align,GGGGGIGGGGG,orientation,size,#8B0000D,SCHEDULEDATE,SUPPERAMT,SCHEDULEDATE,SUPPERAMT+extra
		5,7,FORMULA,temp=SUPPERAMT+((SUPPERAMT - SLOWERAMT) * (FACTOR2 - 1)) * 0.5

		'plot line to mid-point
		5,7,LINE,,Point to Extra from FACTOR2,format,align,GGGGGIGGGGG,orientation,size,#8B0000,88,39.5,SCHEDULEDATE,midpoint
		'TEMPO 5,7,LABEL,ScheduleAmt=Required*Factor2,,FRM,RIGHT,GGHGGGGGGGG,BelowRight,,BLACK,93,38,,

		5,7,FORMULA,temp,alias,0.00,RIGHT,GGHGGGGGGGG,BelowRight,size,BLACK,93,38,,

	5,7,ENDIF

5,7,ELSE

	5,7,LABEL,Predictions not plotted [%Option(11)%],alias,format,align,GGGGGGGGGGG,BELOWRIGHT,size,RED,0,0

5,7,ENDIF 'plot  predictions

'Crop Type and Irrigation Method
'CropType 0 = Permanent(stress=refill), 1 = Annual(stress=lower)

'label with 'stress'
5,7,LABEL,stress,alias,format,align,HGGGGGGGGGG,BelowLeft,size,RED,88,42,,

5,7,BEGINIF,CropType=0

	'save 'permanent'
	5,7,TEXT,temp=Permanent

	'1 pt dot red arrow, pointing to REFIll at the latest reading
	5,7,ARROW,source,Point to REFILL(stress),format,align,GGGGGIGGGGG,orientation,1,RED,85,43.5,CRNTDATE,REFILL

5,7,ELSE

	'save 'annual'
	5,7,TEXT,temp=Annual

	'1 pt dot red arrow, pointing to calculated LOWER at the latest reading
	5,7,ARROW,source,Point to LOWER(stress),format,align,GGGGGIGGGGG,orientation,1,RED,85,43.5,CRNTDATE,LOWERAMT

5,7,ENDIF 'CropType

'show 'annual' or 'permanent', no border, not bold
5,7,LABEL,%temp%,alias,format,LEFT,GGGGGGGGGGG,orientation,size,BLACK,88,42,93,45

'MethodID 0 = Cyclic(flood), 2 = Continous(drip)
5,7,BEGINIF,METHODID=2

	'5,7,TEXT,temp=Continous 'save text
	5,7,LABEL,Continous irrigation (every day),alias,format,LEFT,GGGGGGGGGGG,orientation,size,BLACK,78,42,99,45 'no border, bold

5,7,BEGINELSEIF,METHODID=1'next-7-days

	5,7,LABEL,Next %NUMDAYS days,alias,format,LEFT,GGGGGGGGGGG,orientation,size,BLACK,78,42,99,45 'no border, bold

5,7,ELSE

	'5,7,TEXT,temp=Cyclic 'save text
	'show text, border
	5,7,LABEL,Cyclic irrigation,alias,format,LEFT,GGGGGGGGGGG,orientation,size,BLACK,78,42,99,45 'no border, bold

5,7,ENDIF

'show text, border
5,7,LABEL,%temp%,alias,format,LEFT,GGGGGGGGGGG,orientation,size,BLACK,93,42,99,45 'no border, bold

'deliver amount
5,7,LABEL,ScheduleAMT,alias,format,RIGHT,GGGGGGGGGGG,orientation,size,BLACK,78,46,88,49
5,7,FORMULA,ScheduleAMT,alias,0.00,RIGHT,HGGGGGGGGGG,orientation,size,BLACK,88,46,93,49
5,7,FORMULA,ScheduleAMT,alias,IRR,RIGHT,HGHGGGGGGGG,orientation,size,BLACK,93,46,99,49

'effective amount
5,7,LABEL,Effective,alias,format,RIGHT,GGGGGGGGGGG,orientation,size,BLACK,78,49,88,52
5,7,FORMULA,ScheduleEffectiveAmount,alias,0.00,RIGHT,HGHGGGGGGGG,orientation,size,BLACK,88,49,93,52 '2 decimal places
5,7,FORMULA,ScheduleEffectiveAmount,alias,AMT,RIGHT,HGHGGGGGGGG,orientation,size,BLACK,93,49,99,52 'formatted by ProbeMenu/DisplayUnits

'scheduled date
5,7,LABEL,ScheduleDate,alias,,RIGHT,GGGGGGGGGGG,orientation,size,BLACK,78,52,88,55
5,7,Formula,ScheduleDate,alias,0.0,RIGHT,HGHGGGGGGGG,orientation,size,BLACK,88,52,93,55
5,7,Formula,ScheduleDate,alias,d mmm yyyy HH:MM,LEFT,HGGGGGGGGGG,orientation,size,BLACK,93,52,99,55

'arrow from FACTOR2 to ScheduleAMT to show how FACTOR2 is used
5,7,ARROW,source,point to ScheduleAMT,format,align,GGGGGIGGGGG,orientation,1,RED,93,39.5,93,47

'plot arrows to predicted irrigation
5,7,BEGINIF,MethodID=2

	'continuous
	'small vertical line
	5,7,FORMULA,target=(SUPPERAMT+SLOWERAMT)/2
	5,7,LINE,source,alias,format,align,GGGGGIGGGGG,orientation,1,#006400,SCHEDULEDATE,target-5,SCHEDULEDATE,target+5

	'arrow pointing at target - assume target = (UPPER+LOWER)/2
	5,7,Arrow,source,Continuous:Point to target,format,align,GGGGGIGGGGGG,orientation,1,#006400,88,50.5,SCHEDULEDATE,target

	'point from ScheduleAMT to top/end of drip block
	5,7,Arrow,source,Continuous Point to top of drip block,format,align,GGGGGIGGGGG,orientation,1,#006400,88,47.5,SCHEDULEDATE,SCHEDULEAMT/DRIPDAYS,84

	'point to  EffectiveAMT at end of drip block
	5,7,Arrow,source,Continuous Point to top of drip block,format,align,GGGGGIGGGGG,orientation,1,#006400,88,50.5,SCHEDULEDATE,(SCHEDULEAMT/FACTOR2)/DRIPDAYS,84

	'5,7,BEGINIF,SCHEDULEAMT=0
	'5,7,ELSE
	'5,7,Arrow,source,Continuous Point to top of drip block,format,align,GGGGGGGGGGG,orientation,2,#006400,88,39.5,(CRNTDATE+SCHEDULEDATE)/2,SCHEDULEAMT/DRIPDAYS,84
	'5,7,ENDIF


5,7,ELSE

	'cyclic=
	'highlight how FACTOR2 is used
	'5,7,ARROW,source,Extra amount from FACTOR2,format,align,GGGGGIGGGGG,orientation,size,RED,SCHEDULEDATE,SUPPERAMT,SCHEDULEDATE,SUPPERAMT+temp
	'5,7,FORMULA,temp=SUPPERAMT+((SUPPERAMT - SLOWERAMT) * (FACTOR2 - 1)) * 0.5

	'plot line to mid-point
	'5,7,LINE,source,Point to Extra from FACTOR2,format,align,GGGGGIGGGGG,orientation,size,RED,88,39.5,SCHEDULEDATE,temp2
	'TEMPO 5,7,LABEL,ScheduleAmt=Required*Factor2,,FRM,RIGHT,GGHGGGGGGGG,BelowRight,,BLACK,93,38,,


	5,7,Arrow,,Point to SCHEDULEAMT above UPPER on time graph,,,GGGGGIGGGGG,,1,#8B0000,88,47.5,SCHEDULEDATE,SLOWERAMT+SCHEDULEAMT
	5,7,ARROW,,Point to SUPPERAMT,,,GGGGGIGGGGG,,1,RED,88,50.5,SCHEDULEDATE,SUPPERAMT

5,7,ENDIF


'5,7,Label,Deliver,,0.00,RIGHT,GGGGGGGGGGG,,,BLACK,78,38,88,41
'5,7,Formula,ScheduleAMT,ScheduleAMT*FACTOR2,0.00,RIGHT,HGGGGGGGGGG,orientation,size,BLACK,88,38,93,41
'5,7,Formula,ScheduleAMT*FACTOR2,,IRR,RIGHT,HGHGGGGGGGG,orientation,size,BLACK,93,38,98,41

'UPPER at ScheduleDate 55-58
5,7,LABEL,SUPPERAMT,alias,0.00,RIGHT,GGGGGGGGGGG,orientation,size,BLACK,78,55,88,58
5,7,FORMULA,SUPPERAMT,Value of UPPER at Schedule Date,0.00,RIGHT,HGGGGGGGGGG,,,BLACK,88,55,93,58
'1pt, dotted red arrow
5,7,ARROW,source,Pointing to UPPERAMT at schedule date,orientation,size,GGGGGIGGGGG,orientation,1,RED,88,56.5,SCHEDULEDATE,SUPPERAMT
5,7,FORMULA,SUPPERAMT,alias,AMT,RIGHT,HGHGGGGGGGG,orientation,size,BLACK,93,55,99,58

'LOWER at ScheduleDate 58-61
5,7,LABEL,SLOWERAMT,,0.00,RIGHT,GGGGGGGGGGG,,,BLACK,78,58,88,61
5,7,FORMULA,SLOWERAMT,Value of LOWER at Schedule Date,0.00,RIGHT,HGGGGGGGGGG,,,BLACK,88,58,93,61
5,7,ARROW,,Pointing to LOWER at SheduleDate,,,GGGGGIGGGGG,,1,RED,88,59.5,SCHEDULEDATE,SLOWERAMT
5,7,FORMULA,SLOWERAMT,alias,AMT,RIGHT,HGHGGGGGGGG,orientation,size,BLACK,93,58,99,61

'schedule amount calculations
'see https://www.rsne.com.au/prwin/formulas.htm#scheduleamounts
'If these intermediate values are calculated... 78,88,93,99

'continous in dark green #006400
'cyclic in dark red #8B0000

11,27,BEGINIF,MethodID=2 'continous

	11,27,LABEL,WetArea,alias,format,RIGHT,GGGGGGGGGGGGGG,orientation,size,#006400,78,61,88,64
	11,27,FORMULA,WetArea,Calculated Wet Area,0.00,RIGHT,HGHGGGGGGGGGGGG,orientation,size,BLACK,88,61,93,64 '2 dec places
	11,27,FORMULA,WetArea,Calculated Wet Area,AREA,RIGHT,HGHGGGGGGGGGGGG,orientation,size,BLACK,93,61,99,64 'format with ProbeMenu/DisplayUnits

	11,27,LABEL,MaxApplicationRate:,alias,format,RIGHT,GGGGGGGGGGGGGG,orientation,100,#006400,78,64,88,67
	11,27,FORMULA,MaxApplicationRate,alias,0.00,RIGHT,HGHGGGGGGGGGGGG,orientation,size,BLACK,88,64,93,67
	11,27,FORMULA,MaxApplicationRate,alias,DWU,RIGHT,HGHGGGGGGGGGGG,orientation,size,BLACK,93,64,99,67'ProbeMenu/DisplayUnits
	11,27,Arrow,source,Point to MaxApplicationRate,format,align,GGGGGIGGGGG,orientation,1,#006400,88,65.5,TXMAX,MaxApplicationRate,84'arrow pointing to maximum application rate on RHS axis(StyleID=84)

	11,27,BEGINIF,(ScheduleAMT/DripDays) > (MaxApplicationRate-0.5) 'label if ScheduleAmt above or near MaxApplicationRate

		11,27,LABEL,Limited by Max Rate (%MaxApplicationRate:DWU:1%) !,alias,format,align,HGGGGGGGGGGGGG,Right,100,RED,ScheduleDate,ScheduleAMT/DripDays,,,84

	11,27,ENDIF


11,27,ELSE 'cyclic

	11,27,LABEL,PumpRate:,alias,format,RIGHT,GGGGGGGGGGGGGG,orientation,size,#8B0000,78,61,88,64
	11,27,FORMULA,WATERVOL/WATERTIME/1000,alias,0.00,LEFT,GGGGGGGGGGGGGG,orientation,size,BLACK,88,61,93,64
	11,27,LABEL,%WATERVOL/WATERTIME/1000:0% Ml/day,alias,format,RIGHT,HGGGGGGGGGGGGG,orientation,size,BLACK,93,61,99,64

	11,27,LABEL,Deliver(volume):,alias,format,RIGHT,GGGGGGGGGGGGGG,orientation,100,#8B0000,78,64,88,67
	11,27,FORMULA,DeliverAmountVOL = SCHEDULEAMT * WetArea * 10,alias,VOL,RIGHT,HGGGGGGGGGG,orientation,size,BLACK,88,64,93,67
	11,27,LABEL,SCHEDULEAMT*WetArea*10,alias,format,LEFT,GGGGGGGGGGGGGG,orientation,size,BLACK,93,64,99,67

	'point from Deliver to top/middle of drip block (StyleID=84)
	11,27,Arrow,source,Cyclic - point to top of drip block,format,align,GGGGGGIGGGG,orientation,1,#8B0000,88,65.5,(CRNTDATE+SCHEDULEDATE)/2,SCHEDULEAMT/DRIPDAYS,84


11,27,ENDIF

11,27,LABEL,Deliver(Hours):,alias,format,RIGHT,GGGGGGGGGGGGGG,orientation,100,BLACK,78,67,88,70
11,27,FORMULA,ScheduleTime,alias,0.000,RIGHT,HGHGGGGGGGGGG,orientation,size,BLACK,88,67,93,70
'11,27,FORMULA,ScheduleTime,alias,HH:MM,RIGHT,HGGGGGGGGGGGGG,orientation,size,BLACK,93,67,99,70

11,27,LABEL,ScheduleVolume:,alias,format,RIGHT,GGGGGGGGGGGGGG,orientation,100,BLACK,78,70,88,73
11,27,FORMULA,ScheduleVolume,alias,0.00,RIGHT,HGHGGGGGGGGGG,orientation,size,BLACK,88,70,93,73
11,27,FORMULA,ScheduleVolume,alias,VOL,RIGHT,HGHGGGGGGGGGGGG,orientation,size,BLACK,93,70,99,73


11,27,LABEL,GainStatus:,alias,format,RIGHT,GGGGGGGGGGGGGG,orientation,100,BLACK,78,73,88,76
11,27,FORMULA,GainStatus,alias,0,RIGHT,HGHGGGGGGGGGG,orientation,size,BLACK,88,73,93,76
11,27,LABEL,0=0k:1=ChopToFull,alias,HH:MM,RIGHT,HGGGGGGGGGGGGG,orientation,size,BLACK,93,73,99,76

2,10,FILLCOLOUR,source,alias,format,align,GGGGGGGGGGGGGGG,orientation,size,YELLOW
'11,27,LABEL,GainInformation:,alias,format,RIGHT,GGGGGGGGGGGGGG,orientation,100,BLACK,78,76,88,79
11,27,TEXT,GainInformation,alias,0.00,LEFTWRAP,HGGGHGGGGGGGGG,BELOWRIGHT,size,BLACK,78,76 ',99,88
'11,27,FORMULA,ScheduleVolume,alias,VOL,RIGHT,HGHGGGGGGGGGGGG,orientation,size,BLACK,93,76,99,79


'debug
'11,27,LABEL,AREA=%AREA:0.00% WETWIDTH=%WETWIDTH% PLANTSPACE=%PLANTSPACE% WetArea=%WetArea:0.00% WATERVOL=%WATERVOL% WATERTIME=%WATERTIME%,alias,format,RIGHT,HGGGGGGGGGGGGG,orientation,size,BLACK,58,58,99,60

'================================
8,0,ReportTitle,example_schedulecyclic '
'suggestions for schedule messages
8,1,INCLUDE,example_check 'just for checking

'recommendation text in rectangle, multiple lines. [1]=border H=ON [5]=FillStyle H=solid
'set border 1 pt PALERED
8,2,BORDER,source,alias,format,align,GGGGGGGGGGGGG,orientation,1,PALERED
8,3,TEXT,SITES.COMMENT,alias,format,LEFTWRAP,HGGGHGGGGGGGG,orientation,100,BLACK,82,8,99,43

'can also do recommendation using X,Y, multiple lines.[1]=border=H [5]=FillStyle H=solid
'but cannot handle tabs
8,4,TEXT,SITES.COMMENT,alias,format,align,HGGGHGGGGGGGG,BELOW,100,BLACK,TXMAX,TYMAX-10

'back to standard border
8,5,BORDER,source,alias,format,align,GGGGGGGGGGGGG,orientation,1,BLACK


'schedule message examples

'hold X1,Y1 position of main label
8,6,FORMULA,X1=(CRNTDATE+TXMAX)/2
8,7,FORMULA,Y1=TYRELATIVE(10)

8,8,BEGINIF,SCHEDULEAMT > 0

	'have a schedule amount

	8,9,BEGINIF,MethodID=2
		'continuous
		8,10,FORMULA,DRIP_TOP=SCHEDULEAMT/DripDays
		8,11,TEXT,DATE_TEXT=by %SCHEDULEDATE:ddd D MMM%

		'also point to top/middle of PRGraph drip block. needs StyleID=84 for axis scale
		8,12,BEGINIF,Option(4) AND Option(11) '(4) = plot delivered gains, (11) = plot prediction
			'already plotting predictions, so just do arrow
			'use StyleID=84=drip
			12,32,ARROW,source,Amount=%SCHEDULEAMT:AMT:1% needs applying,format,align,GGGGGGGGGG,orientation,1,DARKGREEN,X1,20,(CRNTDATE+SCHEDULEDATE)/2,ScheduleAMT/DripDays,84

		8,13,ELSE

			'thick line showing extent of drip block
			8,14,LINE,source,apply over %DRIPDAYS% days,format,align,GGGGGGGGGG,orientation,2,WETTING,CRNTDATE,RZ1,SCHEDULEDATE,RZ1

			'point from label 11, 27 to top/middle of double arrow
			8,15,ARROW,source,Amount=%SCHEDULEAMT:AMT:1% needs applying,format,align,GGGGGGGGGG,orientation,1,DARKGREEN,X1,Y1,(CRNTDATE+SCHEDULEDATE)/2,RZ1

		8,16,ENDIF

	8,27,ELSE

		'cyclic

		8,27,TEXT,DATE_TEXT=on %SCHEDULEDATE:ddd D MMM YYYY%

		'delivered amount
		'12,54,LINE,source,Amount=%SCHEDULEAMT:AMT:1% needs applying,format,align,GGGGGGGGGGGGG,orientation,3,GREEN,SCHEDULEDATE,SLOWERAMT,SCHEDULEDATE,SLOWERAMT+SCHEDULEAMT

		'arrow pointing to top of delivered gain
		'SLOWERAMT = RZ1 trip value.  SCHEDULEAMT = mm needed = height of gain bar
		8,54,ARROW,source,Deliver = %FULL:AMT:1% - %REFILL:AMT:1% * %FACTOR2:0.0% ,format,align,GGGGGGGGGG,orientation,1,BLACK,X1,Y1,SCHEDULEDATE,SLOWERAMT+SCHEDULEAMT

	8,27,ENDIF

	'do label last so arrows are hiden by FillColour
	'Recommendation [1]=H=border=H, [2]=H=Bold, [5]=FillStyle H=Solid, [6]=LineStyle G=Solid
	8,27,LABEL,Apply %SCHEDULEAMT:AMT:1% %date_text%,Calculated Schedule,format,align,HHGGHGGGGGGGGGGG,ABOVERIGHT,120,BLACK,X1,Y1,,

8,27,ELSE

	'scheduled amount = zero [1]=border [2]=bold [5]=filled
	11,27,LABEL,No irrigation required this week,Calculated Schedule,format,ABOVERIGHT,HHGGHGGGGGGGGGG,0,120,BLACK,X1,Y1

8,27,ENDIF

'=======================================
9,1,REPORTTITLE,example_scheduleAgritech '

'Alan Christie calculations - cyclic, but DripDays comes in to it

9,2,INCLUDE,example_check 'TEMPO show CropType/Method top left

9,3,BEGINIF,0 'manual calculation

	'calculate predicted deficit in 7 days. include rain
	9,10,LABEL,full=%FULL%  rz1=%RZ1:0.00%  estdwu=%EstDWU:0.00:1% DripDays=%DripDays%,testing,format,align,HGGGGGGGGG,BELOWRIGHT,80,BLACK,10,10

	9,11,FORMULA,PREDICTED_DATE=CRNTDATE+DRIPDAYS
	9,12,FORMULA,PREDICTED_RZ1=(CRNTAMT - (SCHEDULEDWU * DRIPDAYS)) + ForecastRain 'is this what Alan does ???
	9,13,FORMULA,PREDICTED_SMD=SUPPERAMT-PREDICTED_RZ1
	9,14,TEXT,PREDICTED_SMDRANGE=%PREDICTED_SMD:AMT:0%-%PREDICTED_SMD+5:AMT:1%

	'just for checking

	9,15,LABEL,Option(59)=%Option(59)% :FULL=%FULL:0.00:1% :REFILL=%REFILL:0.00:1% :CRNTAMT=%CRNTAMT:0.00:1% :SCHEDULEDWU=%SCHEDULEDWU:0.00:1% :SUPPERAMT=%SUPPERAMT:0.00:1% :PREDICTED_RZ1=%predicted_rz1:0.00:1% :PREDICTED_SMD=%predicted_smd:0.00:1% :PREDICTED_DATE=%predicted_date:d mmm yyyy% :ForecastRain=%FORECASTRAIN:0.00:1% :PredictedRain=%PredictedRAIN:0.00:1%,alias,format,align,HGGGGGGGGGGGGGG,BELOWRIGHT,80,BLACK,0,2
	9,16,LABEL,PREDICTED_RZ1=CRNTAMT - (SCHEDULEDWU * DripDays) + ForecastRain|PREDICTED_SMD = FULL-PREDICTED_RZ1,alias,format,align,HGGGHGGGGGG,BELOWRIGHT,80,BLACK,0,4

	'arrow darkgreen line from current RZ1 to predicted RZ1
	9,17,ARROW,source,Predicted RZ1 in %DripDays% days with EstDWU=%EstDWU:DWU:1% and forecast rain=%FORECASTRAIN:AMT:1%,format,align,GGGGGGGGGG,orientation,1,DARKBLUE,CRNTDATE,CRNTAMT,PREDICTED_DATE,PREDICTED_RZ1

	'double arrow from FULL to predicted RZ1
	9,18,DOUBLEARROW,source,SMD=%PREDICTED_SMD:AMT:1% - needs applying,format,align,GGGGGGGGGGGG,orientation,1.5,DARKBLUE,PREDICTED_DATE,PREDICTED_RZ1,PREDICTED_DATE,SUPPERAMT

	'plot line from text to middle of vertical line
	9,19,LINE,source,alias,format,align,GGGGGGGGGGGG,orientation,1,DARKGREEN,PREDICTED_DATE+8,FULL+10,PREDICTED_DATE,(SUPPERAMT+PREDICTED_RZ1)/2

	9,20,BEGINIF,Option(59) '59 = uc_UseForecastRain

		'using forecast rain
		9,21,LABEL,%FORECASTRAIN:AMT:1% rain forecast in next %DripDays% days|so smd = %predicted_smdrange%,alias,format,align,HGGGHGGGGGGG,ABOVERIGHT,110,BLUE,predicted_date+8,FULL+10,,

	11,22,ELSE

		'not using rain

		11,23,LABEL,If no rain in next %DripDays:0% days|at %SCHEDULEDWU:DWU:1% SMD=%predicted_smdrange%,Deficit at end of next 7 days (%PREDICTED_DATE:ddd D MMM YYYY%),format,align,HGGGHGGGGGG,ABOVERIGHT,110,BLACK,PREDICTED_DATE+8,FULL+10,,

	11,24,ENDIF 'Option(59)

	'details about predicted gain

	'arrow darkgreen line from GainInformation label to middle vertical line
	11,25,ARROW,source,alias,format,align,GGGGGGGGGG,orientation,1,DARKBLUE,TXMAX-2,(TYMAX+TYMIN)/2,SCHEDULEDATE,PREDICTED_RZ1

	'full information about gain
	11,26,TEXT,GainInformation,alias,0.00,LEFTWRAP,HGGGHGGGGGGGGG,RIGHT,size,BLACK,TXMAX-2,(TYMAX+TYMIN)/2

	'gain status
	11,27,BEGINIF,GainStatus>0

		11,28,FILLCOLOUR,source,alias,format,align,GGGGGGGGGGGGGGG,orientation,size,ORANGE
		11,28,TEXT,GainStatusInformation,alias,0.00,LEFTWRAP,HGGGHGGGGGGGGG,RIGHT,size,BLACK,TXMAX+2,MaxApplicationRate,,,84 '84=drip style for scaling
		11,28,FILLCOLOUR,source,alias,format,align,GGGGGGGGGGGGGGG,orientation,size,YELLOW

	11,28,ENDIF 'GainStatus>0

9,29,ENDIF 'manual calculation


9,30,BEGINIF,0 'tempo labels for checking values

	9,31,LABEL,Last week:Rain=%LastDelivRain:AMT:1% Irrigation=%LastDelivIrri:AMT:1%|Effective:Rain=%LastEffecRain:AMT:1% Irrigation=%LastEffecIrri:AMT:1%,alias,0.00,BELOWRIGHT,HGGGHGGGGGGGGG,RIGHT,size,BLACK,50,0

	9,32,LABEL,ScheduleDate=%ScheduleDate:dd mmm yyyy:0% ScheduleAmt=%ScheduleAMT:AMT:1%,alias,0.00,BELOW,HGGGHGGGGGGGGG,BELOWRIGHT,size,BLACK,50,3

	9,33,LABEL,Predicted_rz1=%PredictedRZ1(ScheduleDate):AMT:1% SUPPERAMT=%SUPPERAMT:AMT:1%  smd=%SUPPERAMT-PredictedRZ1(ScheduleDate):amt:1%,alias,0.00,BELOW,HGGGHGGGGGGGGG,BELOWRIGHT,size,BLACK,75,0

	9,34,LABEL,Predicted_rz1=%PredictedRZ1(ScheduleDate):AMT:1% SUPPERAMT=%SUPPERAMT:AMT:1%,alias,0.00,BELOW,HGGGHGGGGGGGGG,BELOWRIGHT,size,BLACK,75,0

	9,35,LABEL,MethodID=%METHODID%,alias,format,align,HGGGHGGGGGGG,BELOWRIGHT,80,BLUE,0,3

	'9,999,FORMULA,temp_supper=(SUPPERAMT-10)

	'9,999,LABEL,Upper=%SUPPERAMT:AMT:1% redrz1=%PredictedRZ1(ScheduleDate):AMT:1%,alias,0.00,BELOW,HGGGHGGGGGGGGG,BELOWRIGHT,size,BLACK,50,0
	'9,99,LABEL,PredictedAmount : ,alias,0.00,BELOW,HGGGGGGGGGGGGG,BELOWLEFT,size,BLACK,50,3
	'9,99,FORMULA,PredictedRZ1(ScheduleDate),alias,0.00,BELOW,HGGGHGGGGGGGGG,BELOWRIGHT,size,BLACK,50,3
	'9~99~FORMULA~temp_1=PredictedRZ1(ScheduleDate)
	'9,99,LABEL,temp_1=%temp_1:AMT:1% temp_2=%temp_2:AMT:1%,alias,0.00,BELOW,HGGGHGGGGGGGGG,BELOWRIGHT,size,BLACK,50,3
	'9,99,LABEL,temp_1=%temp_1:AMT:1% temp_2=%temp_2:AMT:1%,alias,0.00,BELOW,HGGGHGGGGGGGGG,BELOWRIGHT,size,BLACK,50,6
	'9,99,FORMULA,predicted_RZ1=PredictedRZ1(ScheduleDate)

9,35,ENDIF 'check values

9,40,SELECT,MethodID
9~41~CASE~0,1

	'cyclic OR cyclic-7-days, so mark DripDays
	9,42,LINE,source,alias,format,align,GGGGGIGGGGGGG,orientation,1,RED,CRNTDATE,CRNTAMT+2,CRNTDATE,CRNTAMT-2
	9,43,LINE,source,alias,format,align,GGGGGIGGGGGGG,orientation,1,RED,SCHEDULEDATE,CRNTAMT+2,SCHEDULEDATE,CRNTAMT-2
	9,44,DOUBLEARROW,source,alias,format,align,GGGGGIGGGGGGG,orientation,1,RED,CRNTDATE,CRNTAMT+2,SCHEDULEDATE,CRNTAMT+2
	'9,45,LABEL,%DRIPDAYS:0:0% days,alias,format,align,HGGGHGGGGGGG,ABOVEPLUS,80,BLUE,(CRNTDATE+SCHEDULEDATE)/2,CRNTAMT+2
	9,46,LABEL,%SCHEDULEDATE-CRNTDATE:0.0:0% day(s),alias,format,align,HGGGHGGGGGGG,ABOVEPLUS,80,BLUE,(CRNTDATE+SCHEDULEDATE)/2,CRNTAMT+2

9,47,ELSE

	'continuous - no marker

9,48,ENDSELECT 'method

'calculate predicted SMD at schedule date
9,60,FORMULA,predicted_smd=SUPPERAMT-PredictedRZ1(ScheduleDate)
'assemble SMD range text (re Alan Christie)
9,61,TEXT,predicted_SMDRANGE=%predicted_SMD:AMT:0%-%predicted_SMD+5:AMT:1%

'9,99,LABEL,SMD=%predicted_SMD:AMT:1% SMDRANGE=%predicted_SMDRANGE%,alias,0.00,BELOW,HGGGHGGGGGGGGG,BELOWRIGHT,size,BLACK,50,3

'label and arrow for stress
9,71,BEGINIF,CropType=0

	'permanent, so position near REFILL line
	9,72,ARROW,source,alias,format,align,GGGGGIGGGGGGG,orientation,1,DARKGREEN,TXRelative(20),REFILL,CRNTDATE,StressAMT(CRNTDATE)
	9,73,LABEL,Stress (REFILL),alias,format,align,HGGGHGGGGGGG,BELOWLEFT,100,BLUE,TXRelative(20),REFILL

9,74,ELSE
	'annual, so position bottom/left of graph
	9,75,ARROW,source,alias,format,align,GGGGGIGGGGGGG,orientation,1,DARKGREEN,TXRelative(20),TYRelative(80),CRNTDATE,StressAMT(CRNTDATE)
	9,76,LABEL,Stress (LOWER),alias,format,align,HGGGHGGGGGGG,BELOWLEFT,100,BLUE,TXRelative(20),TYRelative(80)

9,77,ENDIF 'crop type

'label and arrow for schedule Crop Daily Water Use near last reading
9,80,ARROW,source,alias,format,align,GGGGGIGGGGGGG,orientation,1,DARKGREEN,CRNTDATE-1,TYRelative(10),CRNTDATE,CRNTAMT

'%ScheduleDWUInformation% has ET * Kc * Ks, etc
9~81~LABEL~Crop Daily Water Use|%ScheduleDWUInformation%~alias~format~align~HGGGHGGGGG~ABOVELEFT~100~BLACK~CRNTDATE-1~TYRelative(10)

'main info for grower
9,90,BEGINIF,Option(59) '59 = uc_UseForecastRain
	'using forecast rain
	'arrow from label to predicted RZ1
	9,91,ARROW,source,alias,format,align,GGGGGGGGGGGG,orientation,1,DARKGREEN,TXRelative(90),TYRelative(10),SCHEDULEDATE,PredictedRZ1(SCHEDULEDATE)

	'label
	9,92,SELECT,MethodID

		9,93,CASE,0 'cyclic
			9,27,LABEL,7 day forecast rain: %FORECASTRAIN:AMT:1%|so smd = %predicted_smdrange% on %SCHEDULEDATE:dddd d mmm:1%,alias,format,align,HGGGHGGGGGGG,ABOVERIGHT,110,BLUE,TXRelative(90),TYRelative(10)
		9,94,CASE,1 'next-7-daysc
			9,27,LABEL,%FORECASTRAIN:AMT:1% rain forecast in next %DripDays% days|so smd = %predicted_smdrange%,alias,format,align,HGGGHGGGGGGG,ABOVERIGHT,110,BLUE,TXRelative(90),TYRelative(10)
		9,95,CASE,2 'continuous

	9,96,ENDSELECT ',MethodID

9,97,ELSE

	'not using forecast rain
	'arrow from label to predicted RZ1
	9,91,ARROW,source,alias,format,align,GGGGGGGGGGGG,orientation,1,DARKGREEN,TXRelative(90),TYRelative(10),SCHEDULEDATE,PredictedRZ1(SCHEDULEDATE)

	'label
	9,98,27,LABEL,If no rain in next %DripDays:0% days|at %SCHEDULEDWU:DWU:1% SMD=%predicted_smdrange%,alias,format,align,HGGGHGGGGGG,ABOVERIGHT,110,BLACK,TXRelative(90),TYRelative(10)

9,99,ENDIF 'UseForecastRain


'================================
12,0,ReportTitle,example_targetrz1 '

'messages about RZ1 relative to UPPER and LOWER

'calculate RZ1 and difference
11,27,FORMULA,currenttarget_rz1=TargetAMT(CRNTDATE)
11,27,FORMULA,target_rz1=TargetAMT(SCHEDULEDATE)
11,27,FORMULA,predicted_rz1=PredictedRZ1(SCHEDULEDATE)
11,27,FORMULA,target_difference=TargetAMT(SCHEDULEDATE)

'debug top left
11,27,LABEL,ScheduleAMT=%ScheduleAMT:0.00:1% TargetRZ1=%target_rz1:0.00:1% predicted_rz1=%predicted_rz1:0.00:1% CurrentTarget=%currenttarget_rz1:0.00:1%,alias,format,align,GGGGGGGGGGG,BELOWRIGHT,80,BLACK,0,3,,

'do current RZ1
11,27,BEGINIF,RZ1 > UPPERAMT

	'too high
	'arrow and warning label
	7,2,ARROW,source,alias,format,align,GGGGGGGGGGGGGGGG,orientation,1,DARKGREEN,CRNTDATE+5,RZ1+5,CRNTDATE,RZ1
	11,27,FILLCOLOUR,source,alias,format,align,GGGGGGGGGGGGG,orientation,size,WARNING
	11,27,LABEL,Too wet - %RZ1-UPPERAMT:AMT:1% above upper|RZ1=%RZ1:AMT:1% Upper=%UPPERAMT:AMT:1%,alias,format,align,HGGGHGGGGGG,RIGHT,100,BLACK,CRNTDATE+5,RZ1+5,,

11,27,BEGINELSEIF,RZ1 < LOWERAMT

	'too low
	'arrow and warning label
	11,27,ARROW,source,alias,format,align,GGGGGGGGGGGGGGGG,orientation,1,DARKGREEN,CRNTDATE+10,RZ1-5,CRNTDATE,RZ1
	11,27,FILLCOLOUR,source,alias,format,align,HGGGHGGGGGG,orientation,size,WARNING
	11,27,LABEL,Too dry - (%LOWERAMT-RZ1:AMT:1%) %RZ1:AMT:1% below lower|RZ1=%RZ1:AMT:1% Lower=%LOWERAMT:AMT:1%,alias,format,align,HGGGHGGGGGG,RIGHT,100,BLACK,CRNTDATE+10,RZ1-5,,

11,27,ELSE

	'in range
	'arrow and ok label
	11,27,ARROW,source,alias,format,align,GGGGGGGGGGGGGGGG,orientation,1,DARKGREEN,CRNTDATE+10,RZ1,CRNTDATE,RZ1
	11,27,TEXT,%RZ1:AMT:1% is in range (%LOWERAMT:AMT:0%-%UPPERAMT:AMT:1%),alias,format,align,GGGGGGGGGGGGGGGG,RIGHT,1,BLACK,CRNTDATE+10,RZ1

11,27,ENDIF

'reset fillcolour
11,28,FILLCOLOUR,source,alias,format,align,HGGGHGGGGGG,orientation,size,YELLOW

'target RZ1
'11,29,BEGINIF,predicted_rz1 > SUPPERAMT
	'could do extra heavy warning if above UPPER ???

11,29,BEGINIF,predicted_rz1 > target_rz1

	'above target

	'label and arrow pointing to predicted RZ1
	11,2,ARROW,source,alias,format,align,GGGGGGGGGGGGGGGG,orientation,1,DARKGREEN,SCHEDULEDATE+5,predicted_rz1+2,SCHEDULEDATE,predicted_rz1
	11,27,FILLCOLOUR,source,alias,format,align,HGGGHGGGGGG,orientation,size,WARNING
	11,27,LABEL,Predicted too wet - %predicted_rz1-target_rz1:AMT:1% above target|Predicted RZ1=%predicted_rz1:AMT:1% on %SCHEDULEDATE:d mmm:% dwu=%ScheduleDWU:DWU:1%,alias,format,align,HGGGHGGGGGG,RIGHT,100,BLACK,SCHEDULEDATE+5,predicted_rz1+2,,

	'vertical arrow showing difference
	7,2,DOUBLEARROW,source,alias,format,align,GGGGGGGGGGGGGGGG,orientation,1,DARKGREEN,SCHEDULEDATE,predicted_rz1,SCHEDULEDATE,target_rz1

	'set too-high
	11,27,FORMULA,ontarget=1

11,27,BEGINELSEIF,predicted_rz1 < target_rz1

	'below target

	'label and arrow pointing to predicted RZ1
	7,2,ARROW,source,alias,format,align,GGGGGGGGGGGGGGGG,orientation,1,DARKGREEN,SCHEDULEDATE+5,predicted_rz1-2,SCHEDULEDATE,predicted_rz1
	11,27,FILLCOLOUR,source,alias,format,align,HGGGHGGGGGG,orientation,size,WARNING
	11,27,LABEL,Predicted too dry - %predicted_rz1-target_rz1:AMT:1% below target|Predicted RZ1=%predicted_rz1:AMT:1% on %SCHEDULEDATE:d mmm:% dwu=%ScheduleDWU:DWU:1%,alias,format,align,HGGGHGGGGGG,RIGHT,100,BLACK,SCHEDULEDATE+5,predicted_rz1-2,,

	'vertical arrow showing difference
	7,2,DOUBLEARROW,source,alias,format,align,GGGGGGGGGGGGGGGG,orientation,1,DARKGREEN,SCHEDULEDATE,predicted_rz1,SCHEDULEDATE,target_rz1

	'set too-low
	11,27,FORMULA,ontarget=2

11,27,ELSE

	'will hit target
	7,2,ARROW,source,alias,format,align,GGGGGGGGGGGGGGGG,orientation,1,DARKGREEN,SCHEDULEDATE+5,predicted_rz1,SCHEDULEDATE,predicted_rz1
	11,27,TEXT,Predicted to hit target (%target_rz1:AMT:0%),alias,format,align,GGGGGGGGGGGGGGGG,RIGHT,80,BLACK,SCHEDULEDATE+5,predicted_rz1,,

	'set just-right
	11,27,FORMULA,ontarget=0

11,27,ENDIF

'reset fillcolour
11,27,FILLCOLOUR,source,alias,format,align,HGGGHGGGGGG,orientation,size,YELLOW

'show arrow from RZ1 to TargetRZ1
11,27,BEGINIF,ontarget>0
	'only if will hit target
	'arrow, 1p, dot, from RZ1 to RZTarget to show what *should* happen
	11,27,ARROW,source,alias,format,align,GGGGGIGGGGGGGGGGG,orientation,1,DARKGREEN,CRNTDATE,RZ1,SCHEDULEDATE,target_rz1
11,27,ENDIF

'label and arrow pointing to target RZ1
7,2,ARROW,source,alias,format,align,GGGGGGGGGGGGGGGG,orientation,1,DARKGREEN,SCHEDULEDATE+5,target_rz1,SCHEDULEDATE,target_rz1,,
11,27,LABEL,Target=%target_rz1:AMT:1% on %SCHEDULEDATE:d mmm:%,alias,format,align,HGGGHGGGGGG,RIGHT,100,BLACK,SCHEDULEDATE+5,target_rz1,,


'========================== use: Site 2, Western Block, Rows 78/79 (ALVINE VINEAYRD) Lynette 2023/24
7,1,REPORTTITLE,example_criticaldates '
7,1,INCLUDE,example_check 'Method/CropType top left

'use CriticalDate6
'2 pt blue vertical line at CriticalDate6
'(but might already be plotted)
7,2,LINE,source,Vertical line at CriticalDate4,format,align,GGGGGGGGGGGGGGGG,orientation,1,BLUE,DATE6,TYMIN,DATE6,TYMAX

7,2,FORMULA,days_togo=DATE4-CRNTDATE

'tempo check
'7,3,LABEL,days-togo=%days_togo:0%,alias,format,align,HGGGGGGGGG,BELOWRIGHT,80,BLACK,10,0,,

'message about season end, top centre of time graph
'7,5,LABEL,%SEASONEND-CRNTDATE:0% days to end of season (%SEASONEND:d mmm:0%),alias,format,align,HHGGHGGGGG,BELOWPLUS,120,BLACK,(TXMIN+TXMAX)/2,TYMAX,,

7,2,BEGINIF,days_togo<20
	7,11,FILLCOLOUR,source,alias,format,align,GGGGGGGGGGG,orientation,size,WARNING
7,2,ENDIF

'message about critical date 6, border, bold, size=150
7,3,LABEL,Only %days_togo:0% days to %Date6Text% (%DATE6:d mmm:0%),alias,format,align,HGGGHGGGGG,LEFT,100,BLACK,DATE6-10,TYMAX-12,,

7,11,FILLCOLOUR,source,alias,format,align,GGGGGGGGGGG,orientation,size,YELLOW 'back to normal

'1 pt DarkGreen arrow from 7,3 label to CriticalDate line
7,4,ARROW,source,Arrow pointing at top of CriticalDate1,format,align,GGGGGGGGGGGGGGGG,orientation,1,DARKGREEN,DATE6-10,TYMAX-12,DATE6,TYMAX-12

'====================
11,1,REPORTTITLE,example_stressatverasion ''

11,99,INCLUDE,example_check 'Method/CropType top left - just for testing

'just for checking values
11,99,LABEL,ForecastRain=%FORECASTRAIN:AMT:1% ForecastET=%FORECASTET:DWU:1%,alias,format,align,HGGGHGGGGG,BELOWLEFT,80,BLACK,100,0


'could also plot TARGET as a line
11,2,PlotExtra,TARGET,alias,format,align,HGGGHGGGGG,orientation,0,BLUE,,,,,2 'StyleID = 2 = RZ1
'testing legend
11,3,LEGEND,Target,alias,format,align,GGGGGIGGGGGGGGGGGG,orientation,1,RED,,,,,2

'explain what this report is about
11,3,FILLCOLOUR,source,alias,format,align,GGGGGGGGGGG,orientation,size,PALEGREEN
11,3,LABEL,Labels for Upper/Lower/Stress/Target/PredictedRZ1 values at a date,alias,format,align,HGGGHGGGGG,BELOW,100,BLACK,50,5,,
11,3,FILLCOLOUR,source,alias,format,align,GGGGGGGGGGG,orientation,size,YELLOW

'details about target and stress at DATE3 (veraison Estimate) Site 2, Western Block Lynette 2023/24'
'set value of plotdate = DATE3 (Veraison)
11,4,FORMULA,plotdate=DATE3

'if *not* plotting CriticalDates, plot vertical line and label
11,5,BEGINIF,Option(17)=0 'Option(17) = plot CriticalDates OFF  GraphMenu/Options/Local tab: time graph see: /prwin3/repdefs.htm#optioncodes

	'blue vertical dotted line at PlotDate
	11,6,LINE,source,alias,format,align,GGGGGHGGGGG,orientation,1,RED,plotdate,TYMIN,plotdate,TYRELATIVE(15)

	'label at PlotDate, 15% below top of graph
	11,7,LABEL,%DATE3TEXT% (%plotdate:d mmm%),alias,format,align,HGGGHGGGGG,BELOWPLUS,120,BLACK,plotdate,TYRELATIVE(15)

	'pink vertical line at Harvest (DATE4)
	11,8,LINE,source,alias,format,align,GGGGGHGGGGGG,orientation,1,BLUE,DATE4,TYMIN,DATE4,TYRELATIVE(20)

	'label centred on DATE4
	11,9,LABEL,%DATE4TEXT% (%DATE4:d mmm%),alias,format,align,HGGGHGGGGG,BELOWPLUS,100,BLACK,DATE4,TYRELATIVE(20)

11,6,ENDIF

'call report: example_plotdate (aka: subroutine)
11,7,INCLUDE,example_plotdate

'could also do other critical dates, SeasonEnd, etc
11,8,FORMULA,plotdate=DATE4
11,9,INCLUDE,example_plotdate

'show Predicted Crop Daily Water Use near last reading
11~10~LABEL~Predicted Crop Daily Water Use = Et * Kc|CDWU = %FORECASTET:DWU:1% * %YValueByDate(CRNTDATE,4):0.00:0% = %SCHEDULEDWU:DWU:1% ~alias~format~align~HGGGHGGGGG~BELOWLEFTPLUS~100~BLACK~CRNTDATE~CRNTAMT

'================ subroutine()
21,1,ReportTitle,example_plotdate ' CRNTDATE

	'only plot PREDICTED if in future
	21,3,FORMULA,plotdate_predicted=PredictedRZ1(plotdate) 'predicted RZ1 on right because will overlap

	21,4,LINE,source,alias,format,align,GGGGGGIGGGG,orientation,1,DARKGREEN,plotdate+1,plotdate_predicted,plotdate,plotdate_predicted

	'label +1 day right of PlotDate
	21,5,LABEL,P=%plotdate_predicted:AMT:1%,alias,format,align,HGGGHGGGGG,RIGHT,80,BLACK,plotdate+1,plotdate_predicted,,

21,6,ENDIF

'Upper value label
21~7~FORMULA~plotdate_upper=YValueByDate(plotdate,0) '0=upper
21,8,LINE,source,alias,format,align,GGGGGGIGGGG,orientation,1,BLACK,plotdate-1,plotdate_upper,plotdate,plotdate_upper
21,9,LABEL,U=%plotdate_upper:AMT:1%,alias,format,align,HGGGHGGGGG,LEFT,80,BLACK,plotdate-1,plotdate_upper,,

'Lower value label
21~10~FORMULA~plotdate_lower=YValueByDate(plotdate,1) '1=lower
21,11,LINE,source,alias,format,align,GGGGGGIGGGG,orientation,1,BLACK,plotdate-1,plotdate_lower,plotdate,plotdate_lower
21,12,LABEL,L=%plotdate_lower:AMT:1%,alias,format,align,HGGGHGGGGG,LEFT,80,BLACK,plotdate-1,plotdate_lower,,

'target value label
21,13,FORMULA,plotdate_target=TargetAMT(plotdate)
21,14,LINE,source,alias,format,align,GGGGGGIGGGG,orientation,1,DARKGREEN,plotdate-1,plotdate_target,plotdate,plotdate_target
21,15,LABEL,T=%plotdate_target:AMT:1%,alias,format,align,HGGGHGGGGG,LEFT,80,BLACK,plotdate-1,plotdate_target,,

'stress (REFILL or LOWER) value label
21,16,FORMULA,plotdate_stress=StressAMT(plotdate)
21,17,LINE,source,alias,format,align,GGGGGGIGGGG,orientation,1,DARKGREEN,plotdate+1,plotdate_stress,plotdate,plotdate_stress
21,18,LABEL,S=%plotdate_stress:AMT:1%,alias,format,align,HGGGHGGGGG,RIGHT,80,BLUE,plotdate+1,plotdate_stress,,

'just for checking values
'21,19,LABEL,%plotdate:d mmm:0% P=%plotdate_predicted:0.00:1% T=%plotdate_target:0.00:1%  S=%plotdate_stress:0.00:1%,alias,format,align,HGGGGGGGGG,BELOWRIGHT,80,BLACK,20,0,,

'calculate stress at PlotDate
21,20,FORMULA,plotdate_difference=plotdate_stress - plotdate_target
21,21,FORMULA,plotdate_middle=(plotdate_stress+plotdate_target)/2

'vertical arrow at plotdate+0.5, from stress to targe to stress
21,28,ARROW,source,alias,format,align,GGGGGGIGGGG,orientation,1,DARKGREEN,plotdate+0.4,plotdate_stress,plotdate+0.4,plotdate_target

'line pointing from label to target
21,29,LINE,source,alias,format,align,GGGGGGIGGGG,orientation,1,DARKGREEN,plotdate+8,plotdate_target,plotdate+0.4,plotdate_target

'strategy label - always palegreen
21,30,FILLCOLOUR,source,alias,format,align,GGGGGGIGGGG,orientation,size,PALEGREEN

'assemble text
21,31,BEGINIF,plotdate_target < plotdate_stress

	'target below stress - strategy is to stress crop
	21,32,TEXT,StrategyText=Strategy: %plotdate_difference:AMT:1% stress on %PLOTDATE:d mmm%

21,33,ELSE

	'not stressed
	21,34,TEXT,StrategyText=Strategy: no stress on %PLOTDATE:d mmm%

21,34,ENDIF

'label at PlotDate + 8 days
21,35,LABEL,%StrategyText%,alias,format,align,HGGGHGGGGG,RIGHT,100,BLACK,plotdate+8,plotdate_target

21,36,FILLCOLOUR,source,alias,format,align,GGGGGGIGGGG,orientation,size,YELLOW 'back to normal

'calculate predicted stress only if PLOTDATE is in future
21,37,BEGINIF,PLOTDATE > CRNTDATE

	'hold diffference stress-predicted
	21,38,FORMULA,plotdate_difference=plotdate_stress - plotdate_predicted

	'vertical arrow at plotdate+0.6, pointing from stress to predicted
	21,39,ARROW,source,alias,format,align,GGGGGGIGGGG,orientation,1,DARKRED,plotdate+0.6,plotdate_stress,plotdate+0.6,plotdate_predicted

	'horizontal line from label to arrow end
	21,40,LINE,source,alias,format,align,GGGGGGIGGGG,orientation,1,BLACK,plotdate+0.6,plotdate_predicted,plotdate+10,plotdate_predicted

	'use function SGN() to check if Predicted is same as Target see https://www.rsne.com.au/prwin3/formulas.htm#sgn
	21,41,BEGINIF,SGN(plotdate_target - plotdate_stress) = SGN(plotdate_predicted - plotdate_stress)
		'predicted same sign as target (ie stress or no stress), so ok, so green
		21,42,FILLCOLOUR,source,alias,format,align,GGGGGGIGGGG,orientation,size,PALEGREEN
		21,42,TEXT,COLOUR=BLACK
	21,43,ELSE
		'predicted different sign from strategy, so warning
		21,44,FILLCOLOUR,source,alias,format,align,GGGGGGIGGGG,orientation,size,WARNING
		21,45,TEXT,COLOUR=WHITE
	21,44,ENDIF

	'label with predicted stress
	21,45,BEGINIF,plotdate_difference < 0
		21,46,TEXT,PredictedText=Predicted: %abs(plotdate_difference):AMT:1% above stress
	21,47,ELSE
		21,48,TEXT,PREDICTEDTEXT=Predicted stress = %plotdate_difference:AMT:1%
	21,47,ENDIF

	21,48,LABEL,%PredictedText%,alias,format,align,HGGGHGGGGG,RIGHT,100,%COLOUR%,plotdate+8,plotdate_predicted

	21,48,FILLCOLOUR,source,alias,format,align,GGGGGGIGGGG,orientation,size,YELLOW 'back to normal

21,48,ENDIF 'PLOTDATE > CRNTDATE

'============================
22,1,REPORTTITLE,example_spares	'

'testing variables
'5,7,LABEL,Option(60)=%Option(60)% CropType=%CropType% TargetOnTop=%TargetOnTop%,alias,format,LEFT,HGGGGGGGGGG,orientation,size,BLACK,78,60,99,65

'crop stage
'16,2,LINE,RED,,,,0,0,1,0,DATE2,TYMAX,DATE2,TYMIN
'16,2,TEXT,Date2Text,,,,0,AbovePlus,100,1,DATE2,TYMAX,,
'16,2,FORMULA,Date2,,d mmm,,0,BelowPlus,100,1,DATE2,TYMAX,,

'Alan Christie
'11,14,Formula,RZ2FULL-RZ2,,AMT,Left,JJGGGGGGGG,0,110,RED,73,34,84,37
'11,14,Formula,RZ2FULL-RZ2-200,,AMT,Left,JJGHGGGGGG,0,110,RED,73,34,84,37
'11,27,Label,Size=    >,,,Left,JJGGGGGGGG,0,110,RED,62,37,98,40

'7,7,Label,Variable,Alias,Format,RIGHT,HHGGGGGGGGG,,,BLACK,50,2,60,5
'7,7,Label,Value,Alias,,LEFT,HHGGGGGGGGG,,,BLACK,60,2,70,5
'7,7,Label,Text,Alias,,LEFT,HHGGGGGGGG,,,BLACK,70,2,80,5

'7,7,Label,SeasonEnd:,,,RIGHT,HGGGGGGGGGG,,,BLACK,50,5,60,8
'7,7,Formula,SeasonEnd,,0.000,LEFT,HGGGGGGGGGG,,,BLACK,60,5,70,8
'7,7,Formula,SeasonEnd,,d mmm yyyy,LEFT,HGGGGGGGGGG,,,BLACK,70,5,80,8

'7,7,Label,CurrentDate:,,,RIGHT,HGGGGGGGGGG,,,BLACK,50,8,60,11
'7,7,Formula,CRNTDATE,,0.000,LEFT,HGGGGGGGGGG,,,BLACK,60,8,70,11
'7,7,Formula,CRNTDATE,,d mmm yyyy HH:MM,LEFT,HGGGGGGGGGG,,,BLACK,70,8,80,11

'=============
12,1,REPORTTITLE,example_forecasts ' 0
	'intersect calculation ok
	21,4,ARROW,source,arrow from LatestReading to intersect,format,align,HGGGGGGGGG,orientation,1,BLUE,CRNTDATE,CRNTAMT,INTERSECTX,INTERSECTY 'arrow from LatestReading to intesect

	'label at Intersect
	21,5,LABEL,%INTERSECTY:AMT:1% on %INTERSECTX:d mmm:0%,alias,format,align,HGGGHGGGGG,ABOVERIGHTPLUS,100,BLACK,INTERSECTX,INTERSECTY

	'rate in middel of arrow
	21,5,LABEL,Rate=%(CRNTAMT-INTERSECTY)/(INTERSECTX-CRNTDATE):DWU:1%,alias,format,align,HGGGHGGGGG,ABOVERIGHTPLUS,100,BLACK,(CRNTDATE+INTERSECTX)/2,(CRNTAMT+INTERSECTY)/2

21,4,ELSE

	'does not intersect, so (debug) label at Latest Reading
	21,5,LABEL,No intersect,alias,format,align,HGGGHGGGGG,ABOVERIGHTPLUS,100,BLACK,CRNTDATE,CRNTAMT

11,6,ENDIF


'=============
11,1,REPORTTITLE,example_check '