Probe for Windows: Export
Probe For Windows can print to paper or pdf, export as text/csv files, build web sites, and send emails and SMS.
Sites to be included in the output can be selected by group, by grower, by crop, or individually selected; and from any season.

A report is selected from the drop-down list.
will preview the output, and will print the report. This could be a physical printer, or to a PDF file if a PDF print driver has been installed.
will generate web pages, and will upload them to a web site
Build Web

As well as printing the report on paper, the output can also be sent to a web site, an rss news feed, or google maps.
The web site will have the same information as the printed output - but see Select Output.
Base name is the name for all files e.g Schedule will output schedule.htm, GoogleMap output in schedule.kml, etc
When is used...
- A PNG file generated for each site.
(even if not uploading to web PNG files could be copy/pasted into MS.Word or a pdf file) - A web page (htm file) generated for each grower.
- A simple notification email or SMS message can be sent to each grower.
- An RSS file generated that can be subscribed to by the grower.
- A WAP file (a special format for mobiles phones). The link to be entered into their phone will sent in an email.
- A KML file that can display in a browser using GoogleMap, or in GoogleEarth on the growers PC - see GoogleEarth
- An email with recommendations can be sent to the grower
, either a single email for all sites, or a separate email for each site.
Emails will only be sent to a grower if an email address is entered on Edit Grower. - An SMS message with recommendations can be sent to the grower, either a single message for all sites, or a separate message for each site.
SMS only sent if mobile number entered on Edit Grower.
Normally output would be a separate web page for each grower, but output can also be to a single web page of all growers.
All files are first created on the local PC, and then files, emails and SMS messages are sent to queues on Internet.
They can be sent immediately, or first check the web site, or change emails and messsages before sending.
See 'options' and 'web' for more details.
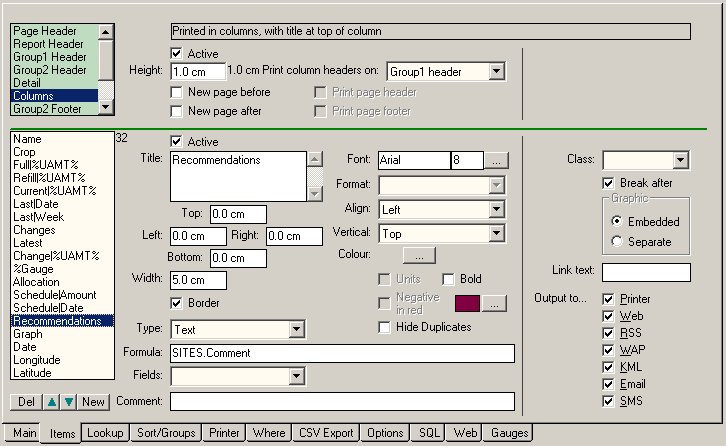
Items
There are different sections in a report - first a report header; a page header at the top of each page; a group header at the top of each group for 'GrowerName'; and a column section of the items being output for each site.
The Report Header section is output once at the beginning - cover sheet.
The Report Footer section is output once at the end - e.g. credits, disclaimers, copyright, etc.
Sections will only be output if they are Active.
Each section can have its height set, and whether it will have a page break before or after the section.
If the section height is not entered it will be automatically calculated from the height and position of all active items in the section.
The column headers (the title at the top of each column) can be printed in the page header; or in the Group header (with the grower name).
All Items in each section are listed in the lower part of the screen.
Only items that are Active will be output.
The title will be printed at the top of the column - (only in columns section)
The height of the 'column titles' will = CharacterHeight * NumberOfLines * 1.1 + 0.2 cm.
For paper output, each item needs the position (cm) (left, top, right, bottom) of a bounding box that the item will print in.
Items in a column will be printed in the 'details' section
They only need a column width (cm) entered - their height will be the 'Columns' section height
If the details section height is too small the f_Sections(fis_Detail).ActualHeight = f_Sections(fis_Columns).ActualHeight
Graphic items can be embedded in the report, and or can be separate, and just a link is shown in the report. 'Separate' graphic items need a width for the link text, but the size of the actual graphic is taken from left/top/right/bottom.
A border can be drawn around an item. Items in the columns section will a have a border width set on Options.
An item can be various types - labels (text), or values from the data base for each site.
Other item types are...
- Gauge - a diagram showing the latest state of site (see gauges)
- Profile - showing changes in VSW down the profile (see gauges)
- Graph - a full graph report.
- Line - the line width in points is entered at 'font size !
The source of the data can be a data field in the database, or a formula.
There is a drop down list of all fields in the database that can be used. For a graph report, this list will be of all graph reports available.
Comment is for any notes about the item - it is not output.
The font and font size, bold, and colour can be set for each item.
Numeric items can have the display format set, and whether unts (e.g. mm) will be output.
Items can be aligned horizontally (left, centre, right), and vertically (top, middle, bottom) inside the bounding box.
Numeric items can display in red (or any other selected coloor) if it is negative; or if the date is less than todays date (e.g. a scheduled date that is late)
Other optiions can be set for web output....
The CSS class or HTML tag that will be used.
If the output is a graphic (e.g a graph) - the output can be a link to the graph instead of the graph itself. This allows large graphs to be invluded in teh output without taking up too mush space in the main output table.
The link needs entering e.g. click for graph.
Selective Output
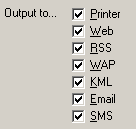
Whether an item is output to the varous destinations can be selected.
For example, an item like a line in the page footer could be output to a printed page, but not output to the web page.
If the SMS message to be SiteName and Recomemndations, the 'site name and recoomendations items should have SMS , and all other items SMS .
Lookup files
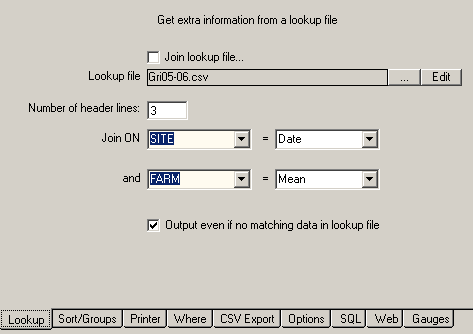
Values from a text file can be output with the data from each sites
For example, an area being monitored at a single location could have several valves delivering water.
A report could be printed, or exported as a csv file top a controller, that has a line for each output valve and not just a line for each site.
Sorting and Grouping
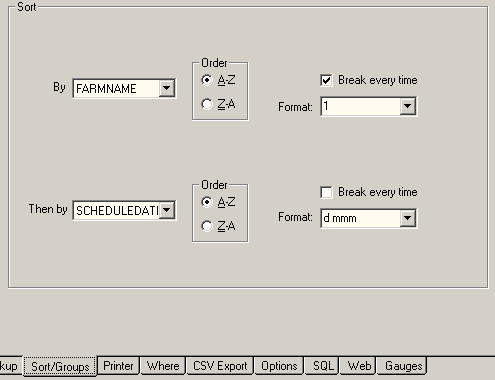
The output can be first sorted by, say, Grower, and then by Site Number.
A group break, with an optional new page, can be output - e.g. a break to give a heading for each grower.
A scheduling report could be first sorted by Grower and then by scheduled date, with a break on each grower, and another break on each day.
The output could have all sites due for irrigation on a day printed in a group on a separate page.
Printer
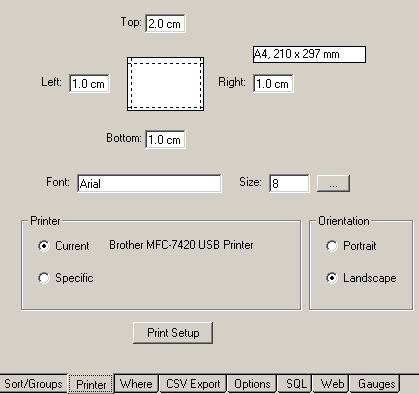
A printer and paper orientation selected, and margins set.
The font size is the the default font size for any items that do not have a font specified.
Where - which sites will be output
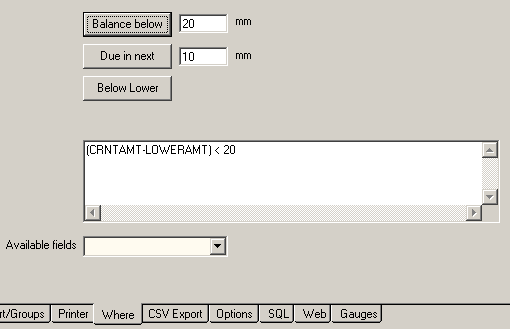
Which sites will be output is selected on the main tab, but extra critera can also be set.
For example, only sites scheduled for irrigation in the the next 3 days.
Export as text file
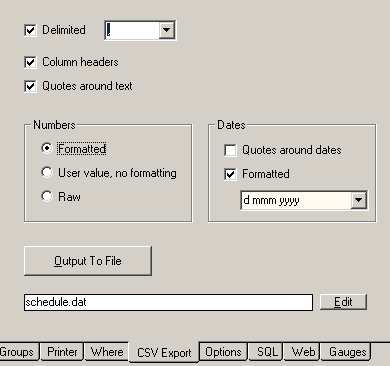
Data can be exported in a file for use by Excel or other software. It is exported as one line per site or lookup file entry, with items separated with commas (or another delimiter).
Only items in the Columns and Group Header sections are output.
The first line in the file can be the column headers.
Numeric values can be formatted (decimal places), or unformatted in order to do further calculations in a spreadsheet.
The data can be in user units (e.g mm or ins, depending on user preferences), or the underlying raw data (metric).
Dates can be formatted with the standard Microsoft format codes, or as as days-since-1-Jan-1900 (as used by Excel)).
Options
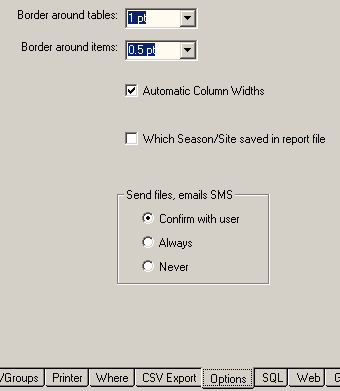
The width of the the border that is printed around items and tables can be selected.
If the total width of all columnms is wider than the net width of the paper, the column widths can be automatically adjusted to fit on the page.
When building web sites, the html files are first saved in folders on the local PC. They are then uploaded by frtp to a web server.
This uploading can be done automatically every time a web site is buult, or manually by using {internet}.
SQL
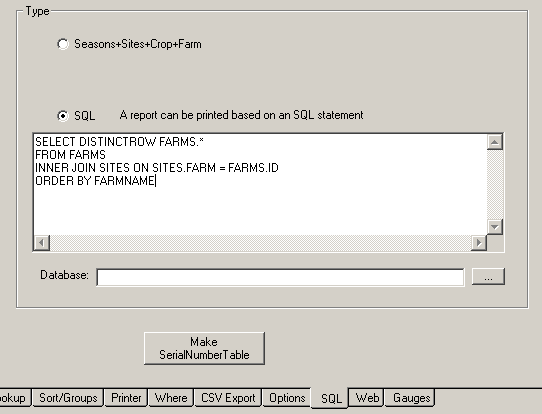
Reports can also output other data - for example a list of all growers, or a list of all neutron probes by serial numbers used.
Web/email
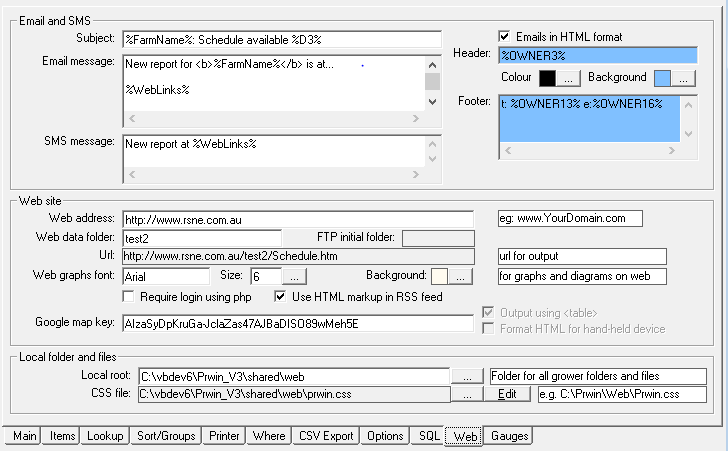
tab: Web
- When a web site is updated an email can be sent to each grower notifying them of changes to their web site.
The text of the email can also have '%wildcards%, that are replaced by actual values from the database as the emails are sent.
For example%FarmName%will be replaced with the actual grower name e.g.ABC Growers%WebLink%will be replaced with the links to the growers web site (and to any other output such as kml or rss feeds)
See here for a list of available wildcards.
Configure email on FileMenu/Internet -
Growers can also be sent an SMS message to notify changes on the web site.
The message can have the same wildcards as emails, but when expanded the SMS 160 character limit must not be exceeded.
Configure SMS on FileMenu/Internet - Emails can be in html format, with a header and footer
The header and footer text colour and background colour can be set
Can have html text - eg links to logos.
Additional styling can be set in the css file.
- The web address is the base address of the web site e.g.
www.irrigation.com. - The web data folder is the folder below the web address for files e.g
webdata.
Note: A file for a grower will be:http://WebAddress/WebDataFolder/GrowerFolder/BaseName.htm.
eg:http://www.irrigation.com/webdata/johnson/schedule.htm. - The local root folder is where the htm files will be initially created before sending to the web site. e.g.
C:\Prwin\Shared\WebData. -
CSS is used to style the web outputS. The CSSfile must be in the local root folder
(C:\Prwin\Shared\WebData\prwin.cssand also on the live web sitewww.irrigation.com/webdata/prwin.css. - For the web all graphs and diagrams are generated as PNG files, and the font used for text and the background colour can be specified.
- Require login using php will output .php files, but with the php login code in: '???'
{TODO folder WebRoot\Login created WebRoot\login\users.dat populated by frm_Farms.OutputUsers() ID, Username, Password, Folder, Fullname, Email uploaded to RemoteRoot/Login/users.dat link added to report footer: logout htm output files have extension .php <?php require "login/login.php" ?> added to top of each output file } - HTML markup in RSS feed - output to a RSS file will be in html
- Google Map Key: TODO
Google Earth and Google Maps
Google Earth is a desktop application that is used by many growers to aggregate different types of data.
For example 'yield' output by harvesters; soil maps; ??; and current soil moisture status from Probe For Windows
The latest soil moisture status will be automatically displayed to the grower
Google Maps is available in a browser (eg Edge, Firefox, Chrome), or as an app on mobile devices.
Growers can use My Maps to set up a map of their property
(eg Farm Industry News Cotton)
, and then add a reference to their soil moisture kmz file (http://WebAddress/WebDataFolder/GrowerFolder/schedule.kmz.
The kmz file can also be shown in a web (html) page.
schedule_map.htm is a simple example of how the kmz file can be used - a satellite map with an icon at each site showing a 'gauge'
When a user clicks on a 'gauge', more details of the site are shown, either in a popup box or in a table below the map.
There are other Geographic Information Sustems (GIS) software that can use kmz files - Marble, NASA World Wind
Files created...
| File | Notes | |
|---|---|---|
schedule.htm | schedule | main report for the grower |
schedule_map.htm | Map | Google map report |
gr99_1234.png | Graph report (report=99) | |
g1234.png | 'Gauge' showing current state of a site relative to Full and Refill | |
gp1234.png | 'Gauge' showing previous state of a site relative to Full and Refill | |
pg1234.png | Profile diagram, showing changes that have occured since the previous reading | |
b1234.png | A 'bucket' showing how much water remains of the allocated volume | |
schedule.kml | Contains the GPS coordinates of each site; links to the 'gauge' files; and information about each site. Can be used by Google Earth (how???) | |
schedule.kmz | zip of schedule.kml plus all 'gauge' png files. Used by schedule_map.htm and also by Google Earth (how ???) | |
schedule.rss | rss feed | Podcast/rss |
schedule.wml | WML | Can be used by ??? |
Gauge Options
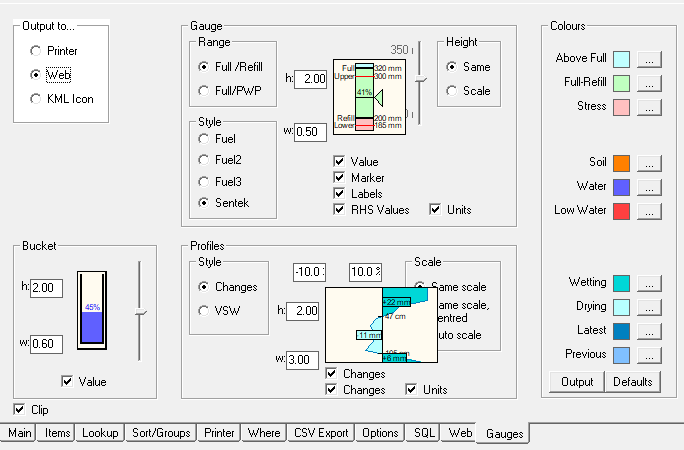
tab: Gauges
- Output can be to the Printer (also sites screen *.spt)); to the web; or as an icon.
Each output type can be seperately styled and sized.
The gauge is output as an icon that will be shown on map output - Gauge
- Shows the relative water status between Full and Refill (or Full/PWP)
The gauge style can be a fuel gauge, or styled similar to Sentek. - The height of the gauge can be the same for all sites
or it can scaled to mm, so the gauge height will depend on the soil deficit. - The height and width of the diagram can be set for web output.
For Printer output the size is set by the row height and column height, as set on tab: 'items'
For Icon output the size is set ???
- Shows the relative water status between Full and Refill (or Full/PWP)
- Profiles
- Shows changes in water content (VSW) at different depths down the soil profile
- Style - show either the change in VSW, or in actual VSW (as shown on depth graph)
- Scale The horizontal scale can be the same for every site (which means the relative deficit will be show
Or same scale but centered - the vertical axis in the middle of the diagram, so that all sites are aligned
Or the scale can be set autmatically, so each site will have a different scale. - The height and width of the diagram can be set for web output.
For printer output the size is set by the row height and column height, as set on tab: 'items'
- Bucket
- Shows a bucket that contains the volume of water remaining of the volume allocated at the start of the season
- volume amount of will be full at the beginning of the seaosn (with the allocated ML), and then gradually reduce during the season as teh Allocation is used
- Configure ???
- see ???
- Colours
- These Colours are also used on the sites screen
- They are independant of Graph style colours
- will ???
- will set all colours back to their default value.